397 results
Graphing Common Core 6.SP.B.4 resources
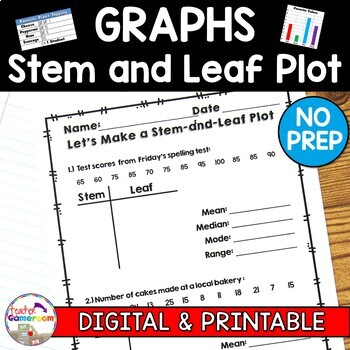
Making a Stem and Leaf Plot with Mean, Mode, Median, Range Worksheets
These worksheets allows students to make a stem and leaf plot using a given set of data. Student must build the plots on their own and then must find the mean, median, mode, and range of the data. There are 4 worksheets, each with 2 Stem and Leaf graphs to be made. Great for review or as a homework assignment. Full Page answer keys included. Extra licenses are $0.75.Questions/Materials include:✔️ 2 Questions per page✔️ 4 Worksheets✔️ 10 - 12 Numbers per graph✔️ 2-Digit and 3-Digit Numbers✔️ Rea
Grades:
4th - 8th
Types:
CCSS:
Also included in: Graphs Bundle | No Prep Digital Resources
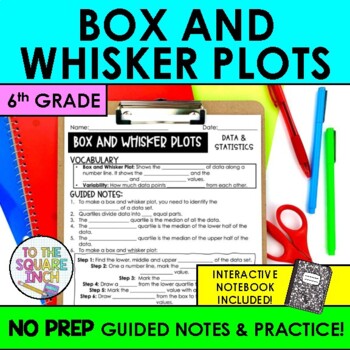
Box and Whisker Plot Notes & Practice | Box Plot Diagram Guided Notes
Searching for an effective way to teach your students how to make and interpret box and whisker plots? These NO PREP guided notes are a classroom proven resource that will save you time and have your students proficient in box and whisker plot in no time! With a comprehensive design, these notes offer a structured approach that can be differentiated for every level of learner. Guided notes are an effective teaching model that maximize your students ability to use working memory to focus on conte
Subjects:
Grades:
5th - 7th
CCSS:
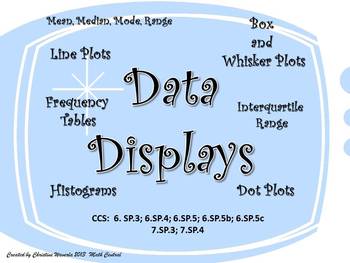
Data Displays: Line Plots, Histograms, Box and Whisker Plots, Frequency Tables
This is one of my favorite teaching tools! I created this Data Display set of worksheets this year for my 6th grade class. My students loved using these worksheets to practice their new skills. Each worksheet provides plenty of room for students to create their data displays and answer questions based on the data. Questions ask students to find the mean, median, mode, range, interquartile range, and percentages.These worksheets are fully aligned with the Common Core Curriculum.CCS: 6.SP.3; 6.SP
Subjects:
Grades:
6th - 8th
Types:
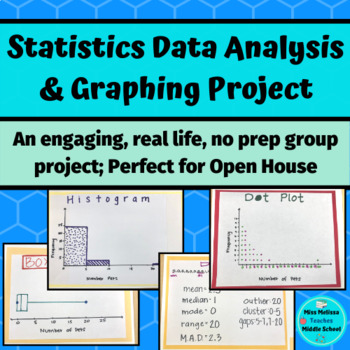
Statistics Project: Data Analysis & Graphing- real life, no prep
This statistics project is intended as a closure for your sixth grade statistics unit and aligns with ALL of the sixth grade statistics and probability common core state standards. In groups, students work together to choose a statistical question to ask the class. Once the class is surveyed, the group works together to create a frequency table, a dot plot, a histogram, and a box and whiskers plot. After creating their graphs, the groups analyze their data by looking at the mean, median, mode ra
Subjects:
Grades:
6th - 7th
Types:
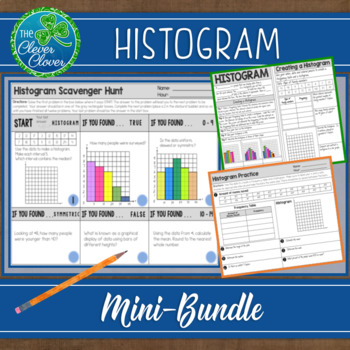
Histogram - Notes, Practice Worksheets and Scavenger Hunt
This histogram resource includes guided notes, a practice worksheet and a scavenger hunt. Your students will have the opportunity to create, interpret and discuss histograms. Below, you will find a detailed description of the notes, worksheet and scavenger hunt. Guided NotesThere are two small pages of guided notes. The first page provides the definition of a histogram and step by step instructions on how to create a histogram. The bottom portion of the notes has students examine three types (un
Subjects:
Grades:
6th - 9th, Adult Education
CCSS:
Also included in: Statistics Bundle - Guided Notes, Worksheets & Scavenger Hunts!
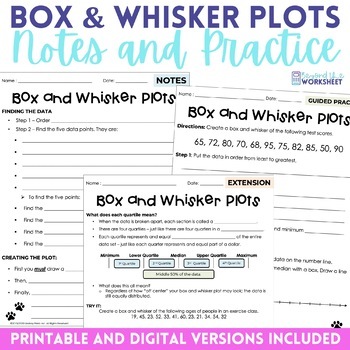
Box and Whisker Plots | Data Analysis Math Notes and Practice
⭐️⭐️ Elevate Data Analysis Skills with this Box and Whisker Plot Activity! This comprehensive resource takes students on a step-by-step journey to master the art of creating and interpreting box and whisker plots, a crucial skill for understanding data distribution. ✅ What's Included:Detailed Instructional Notes: A page of in-depth guidance ensures students grasp the concept thoroughly.Guided Practice Sheet: Hands-on learning becomes a breeze with this interactive worksheet.Extension Sheet: Chal
Grades:
6th - 7th
Types:
Also included in: 6th Grade Math Curriculum Supplemental Activities Bundle
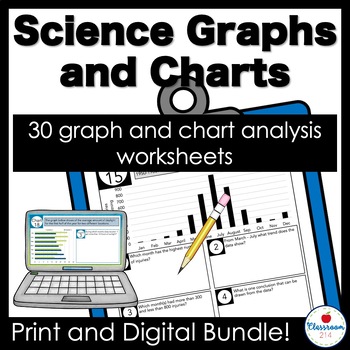
Middle School Science Graphs Worksheets Print and Digital Bundle
Reading graphs is challenging! Teach your students to master comprehending and analyzing charts, graphs, and diagrams in just a few minutes a day! This mega pack gives students a graph or chart and five questions to help them comprehend and analyze it. Use with Google™ Slides or print them out.If your students are like mine, they collected data well during a scientific investigation, but struggle to understand and interpret what the data means. I solved this problem by creating this digital
Subjects:
Grades:
4th - 8th
Types:
NGSS:
MS-ESS3-2
, MS-LS2-1
, MS-ESS3-3
, MS-PS3-1
, MS-ETS1-3
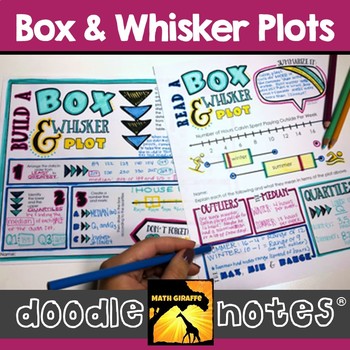
Box and Whisker Plots Doodle Notes
reading and creating box & whisker plots: visual interactive "doodle note" setWhen students color or doodle in math class, it activates both hemispheres of the brain at the same time. There are proven benefits of this cross-lateral brain activity:- new learning- relaxation (less math anxiety)- visual connections- better memory & retention of the content!Students fill in the sheets, answer the questions, and color, doodle or embellish. Then, they can use it as a study guide later on. G
Subjects:
Grades:
6th - 8th
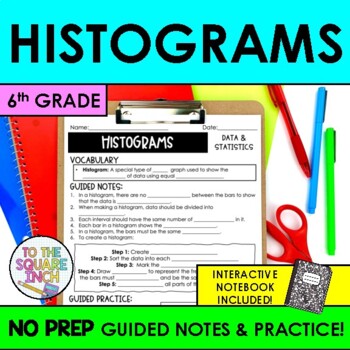
Histograms Notes & Practice | Guided Notes for Histogram Data Displays
Searching for an effective way to teach your students how to read histrograms? These NO PREP guided notes are a classroom proven resource that will save you time and have your students proficient in histograms in no time! With a comprehensive design, these notes offer a structured approach that can be differentiated for every level of learner. Guided notes are an effective teaching model that maximize your students ability to use working memory to focus on content, rather than copying down notes
Subjects:
Grades:
5th - 7th
CCSS:
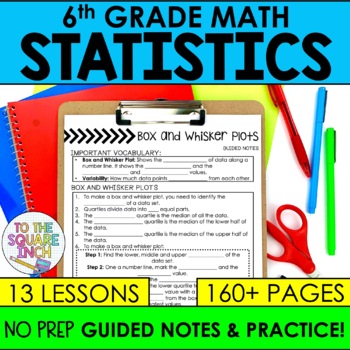
6th Grade Statistics and Probability Notes & Activities Unit | Data Sets
Looking for 6th grade guided notes for Statistics and Probability that are designed to help your students thrive and save you the time and energy of writing and designing them yourself? These NO PREP guided notes are a classroom-proven resource that will have your students proficient in entire 6th Grade Math statistics and probability common core standards. With a comprehensive design, these notes offer a structured approach that can be differentiated for every level of learner for the entire u
Subjects:
Grades:
5th - 7th
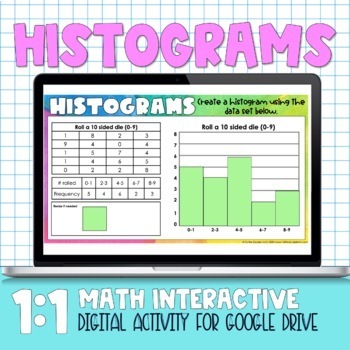
Histograms Digital Practice Activity
Histograms Digital Practice ActivityThis product is a Google Slides product- students can complete it digitally. Included in this product: -4 different histogram problems- students have to drag and drop to create histogram plots-4 page printable version-Answer KeysCheck out my other Distance Learning Digital Products Here
Subjects:
Grades:
6th - 7th
Also included in: Statistics Digital Activities
6th Grade Math STAAR Practice Bundle - Progress Monitoring by Domain
Make sure your students are mastering the standards at a rigorous high-stakes testing level. These TEKS & STAAR Aligned 10-Question Assessments are easy to incorporate as quick checks, review, practice, progress monitoring, guided math, intervention, and STAAR test-prep! These STAAR Practice assessments are grouped by related standards/topics allowing for targeted practice. The 10-question format makes test prep, review, and practice much more manageable!⭐ This resource is now available for
Subjects:
Grades:
6th
Types:
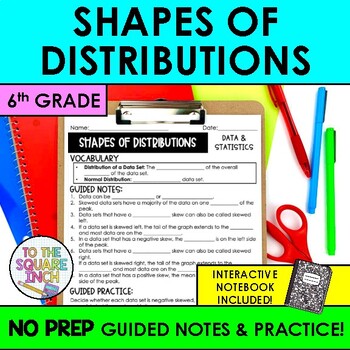
Shapes of Distributions Notes & Practice | Data Displays & Distributions
Searching for an effective way to teach your students how to read shapes of distributions? These NO PREP guided notes are a classroom proven resource that will save you time and have your students proficient in shapes of distributions in no time! With a comprehensive design, these notes offer a structured approach that can be differentiated for every level of learner. Guided notes are an effective teaching model that maximize your students ability to use working memory to focus on content, rathe
Subjects:
Grades:
5th - 7th
CCSS:
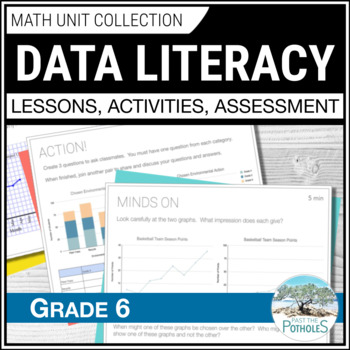
Data Management Unit: Reading Graphs Collecting & Analyzing Data Grade 6 Ontario
Save time and reduce stress!! This UPDATED Grade 6 Ontario Math Data Literacy unit has EVERYTHING YOU NEED. Students will learn about reading graphs, collecting data, analyzing data, misleading graphs, averages, and more. It includes 3-part Google Slides lessons, worksheets, games, centres, assessments, and report card comments. New histograms, broken-line graphs and infographic content are included with data analysis and data collection! SPECIFIC LESSON TOPICS:✓ Discrete and Continuous Data✓
Subjects:
Grades:
5th - 7th
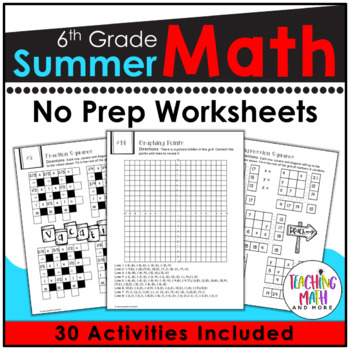
6th Grade Summer Packet | Summer Math Worksheets Grade 6
Need to review math skills? A Summer Math packet that your 6th grade students will want to complete! This packet is FUN and FULL of sixth-grade math problems. Students love the fun coloring, puzzles, and problem solving activities. Save 30% on this resource in the 6th grade math worksheets for the year!How to use it:1. A fun review at the end of 6th grade during May & June or after testing!2. A summer packet for students to complete at home during June, July, & August!3. A beginning of 7
Subjects:
Grades:
6th - 7th
Types:
Also included in: Math Worksheets 6th Grade BUNDLE
Analyzing Plots, Graphs, and Tables using Measures of Central Tendency
This product provides students the opportunity to analyze data presented in different ways. By making calculations and analyzing data, students make conjectures and justify them using mathematical reasoning and evidence!What is included?This product contains 8 student work pages. Each work page contains a set of data displayed graphically with accompanying questions. The data displays included are 2 dot plots, 2 bar graphs, 2 frequency tables, and 2 stem-and-leaf plots. Students are required
Subjects:
Grades:
5th - 11th
Types:
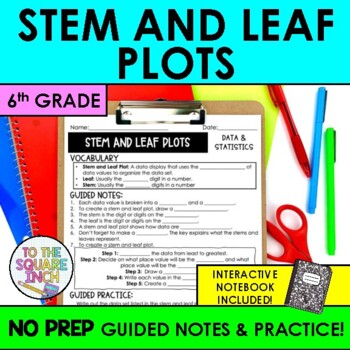
Stem and Leaf Plot Notes & Practice | + Interactive Notebook Pages
Searching for an effective way to teach your students how to read and interpret stem and leaf plots? These NO PREP guided notes are a classroom proven resource that will save you time and have your students proficient in interpreting stem and leaf plot in no time! With a comprehensive design, these notes offer a structured approach that can be differentiated for every level of learner. Guided notes are an effective teaching model that maximize your students ability to use working memory to focus
Subjects:
Grades:
5th - 7th
CCSS:
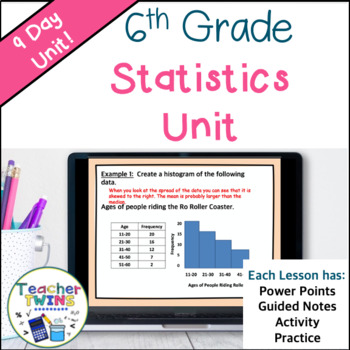
Statistics Unit Grade 6 - Mean - Median - Mode - Histograms - Box Plots
Make lesson planning easy with this no-prep Statistics - Mean, Median, Mode - Histograms - Box Plots Unit! Included are 9 ready-made lessons to teach finding the mean, median, and mode as well as interpreting and creating dot plots, histograms, and box-and-whisker plots. This unit is very easy to use and will save you a lot of time! Your students will learn how to find mean, median, and mode and interpret box-and-whisker plots by using our editable PowerPoints with guided notes. Students will lo
Grades:
5th - 7th
Also included in: 6th Grade Math Curriculum Bundle
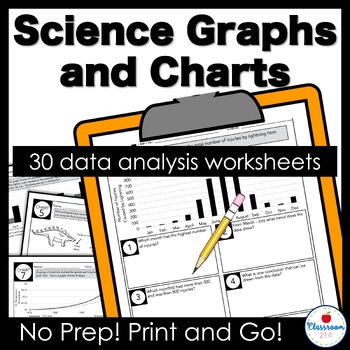
Middle School Data Analysis Reading Graphs Worksheets
Reading graphs and interpreting data is challenging. Teach your science students to master comprehending and analyzing charts, graphs, and diagrams in just a few minutes a day! This mega pack gives students a graph or chart and five questions to help them read and analyze it.***This is the print version.***Click here to see the print and digital bundle with four FREE bonus charts!If your students are like mine, they collected data well during a scientific investigation, but struggle to underst
Subjects:
Grades:
4th - 8th
Types:
NGSS:
MS-LS4-3
, MS-LS4-1
, MS-ETS1-4
, MS-LS2-1
, MS-ETS1-3
Also included in: Middle School Science Graphs Worksheets Print and Digital Bundle
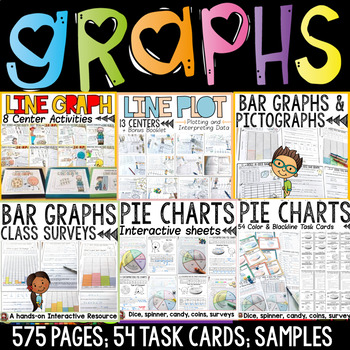
Bar Graphs Pictographs Line Graphs Line Plots Pie Charts Data Collection Bundle
The graphing bundle features interactive activities for creating and interpreting bar graphs, pictographs, line graphs, line plots and pie charts. Your entire graphing unit for a year!Separate folders featuring both British English and US spellings and terminology included.Great quality and value for this whopping 575 + page unit on graphing! Data is collected and interpreted using concrete materials such as visuals, dice, spinners, coins and other real-life objects and contexts. Further details
Subjects:
Grades:
2nd - 6th
Types:
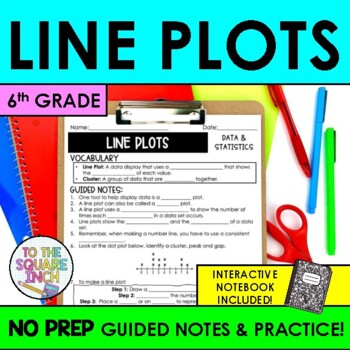
Line Plot Notes & Practice | Line Plots Guided Notes | + Interactive Notebook
Searching for an effective way to teach your students how to read line plots? These NO PREP guided notes are a classroom proven resource that will save you time and have your students proficient in line plots in no time! With a comprehensive design, these notes offer a structured approach that can be differentiated for every level of learner. Guided notes are an effective teaching model that maximize your students ability to use working memory to focus on content, rather than copying down notes.
Subjects:
Grades:
5th - 7th
CCSS:
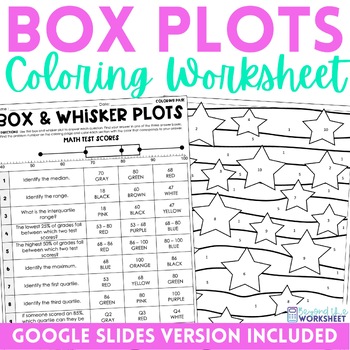
Box and Whisker Plots Coloring Worksheet | Print and Digital
⭐️⭐️⭐️ This data displays activity gives students an engaging and self checking way to practice interpreting box and whisker plots. Students need to have an understanding of the data points (minimum, 1st quartile, median, 3rd quartile, maximum) as well as the interquartile range and know that each quartile represents 25% of the data. It's a wonderful activity that incorporates fun into the classroom! Use it as a quick percents assessment tool, a homework assignment, or even something for the kid
Grades:
6th - 7th
Types:
Also included in: 6th Grade Math Curriculum Supplemental Activities Bundle
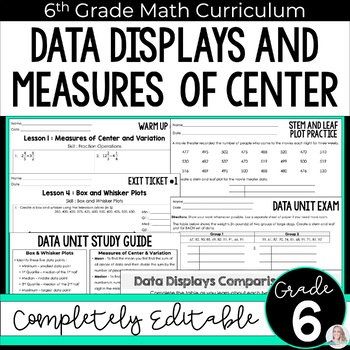
Data Displays Unit 6th Grade Math Curriculum
6th Grade Data Unit - Completely editable to help you best meet the needs of your students!Click here to purchase the digital notebook version of this unit. 6th Grade Math Curriculum Unit 7 {Buy the full curriculum HERE}This unit includes five multi-day lessons that the following skills :Measures of Center and VariationLine Plots and Stem and Leaf PlotsFrequency Tables and HistogramsBox and Whisker PlotsCharacteristics of Data DisplaysIncluded in this resource: Google Forms versions of the asses
Subjects:
Grades:
6th
Also included in: 6th Grade Math Curriculum: Comprehensive, Engaging & Standards-Aligned
6th Grade SBAC Math Performance Task (PT) Test Prep Bundle
Student confidence and competence will soar with these low-prep math performance tasks! Math performance tasks give students the opportunity to use problem-solving skills that prepare them for the real world. The tasks in this bundle also prepare students for success with the Smarter Balanced Assessment Consortium (SBAC), the Partnership for Assessment of Readiness for College and Careers (PARCC), the California Assessment of Student Performance and Progress (CAASPP), the State of Texas Assessme
Subjects:
Grades:
6th - 7th
Types:
Showing 1-24 of 397 results


