9 results
General science Common Core 6.SP.B.4 resources
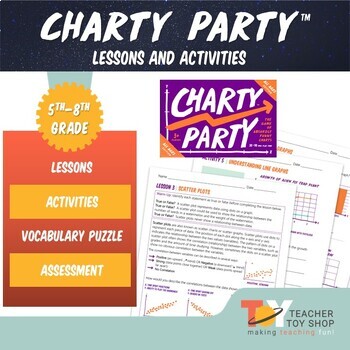
Graphing Lessons and Activities for Charty Party Game
Explore the engaging world of graphing with these Graphing Lessons and Activities for Charty Party Game, featuring nine interactive lessons that seamlessly blend learning with the excitement of a party game. Designed to teach line graphs, bar graphs, scatterplots, and more, these lessons are presented in kid-friendly language, making graphing concepts accessible and enjoyable for students. As they analyze graphs during the Charty Party™ game, students not only practice graphing but also delve in
Subjects:
Grades:
6th - 8th
Types:
NGSS:
MS-ESS3-2
, MS-ETS1-3
Also included in: Physical Science Activities and Lessons Bundle
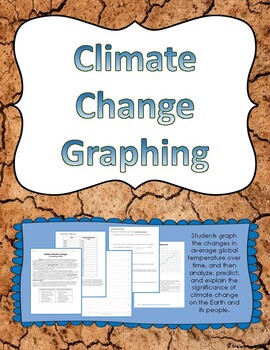
Climate Change Graphing Activity
Students graph the changes in average global temperature over time, and then analyze, predict, and explain the significance of climate change on the Earth and its people.Students read info related to climate change, then create a graph of average global temperature changes over the past 140 years. Students are then to answer several analysis questions, which could also be used to drive a meaningful classroom discussion about climate change.Included is a teacher's key which shows what the resulti
Subjects:
Grades:
5th - 11th
Types:
CCSS:
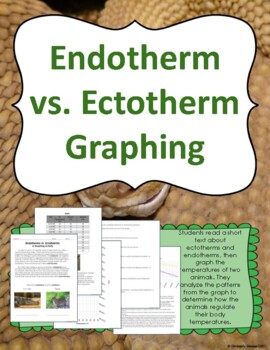
Endotherm vs. Ectotherm Graphing // Animal Temperature // Warm and Cold Blooded
Students graph three lines on one graph: one of the air temperature, one of a cold-blooded animal, and one of a warm-blooded animal. They must decided which animal is which by looking at the graph. The students then answer several more questions about the graph. **This file has been updated in 2021 to include a short text about endotherms and ectotherms, as well as a teacher resource page with answers and the finished graph. It is also able to be used with the TPT Easel app.**Topics: Endotherm
Subjects:
Grades:
4th - 9th
Types:
CCSS:
Middle School/Upper Elementary Scientific Method and STEM Fair Unit
This unit was designed as a way to incorporate STEM into a more traditional Science Fair model with connections to STEM careers. Students are encouraged to choose a topic that they are deeply interested in and they learn how to connect scientific thinking to concepts outside of science class. They are also introduced to future STEM careers and community resources. The unit is directly aligned to Next Generation Science Standards (NGSS) and the Common Core.
In order to help students achieve t
Subjects:
Grades:
4th - 11th
Types:
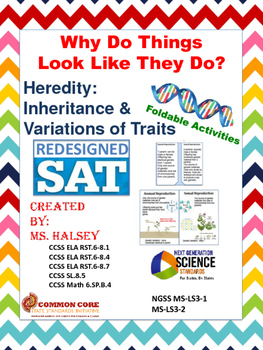
Why Do Things Look Like They Do? Heredity: NGSS MS LS3-1, 3-2(Editable)
NGSS:MS LS3-1, MS LS3-2
CCSS ELA RST.6-8.1, RST.6-8.4, RST.6-8.7, SL.8.5, Math 6.SP.8.4
3 Foldable Activities
New SAT Prep
K-12 Framework and NGSS
This Heredity Unit contains multiple lessons covering the Next Generation Life Science Standard (Heredity: Inheritance and Variation of Traits) MS-LS3-1 and MS-LS3-1, with a focus on the overarching questions: “Why Do Things Look Like They Do?” Common Core Reading (RST.6-8.1, RST.6-8.4, RST.6-8.7), Speaking and Listening (SL.8.5) and Math (6.SP.
Subjects:
Grades:
6th - 8th
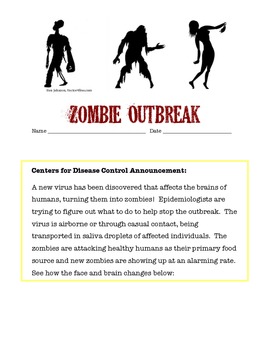
Investigating the Spread of a Viral Outbreak
Students in grades 5 - 9 model the spread of an infectious disease under the entertaining theme of a zombie outbreak. One student unknowingly is patient zero and students simulate the spread of an airborne illness. This highly engaging activity covers health topics, nature of science, and math skills as students graph data in a line plot. Higher level students can be challenged to find the function of the exponential growth of the outbreak.
Subjects:
Grades:
6th - 9th
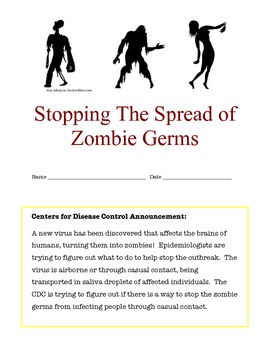
Preventing The Spread of Zombie Germs!
Students in grades 5 through 8 can actually measure the effectiveness of hand washing in a scientifically controlled way. Students identify variables, complete data tables, graph results and analyze their data. Teachers will need access to a black light and a small drop of glow in the dark paint. Kids really enjoy this activity and it utilizes many Common Core skills.
Subjects:
Grades:
5th - 8th
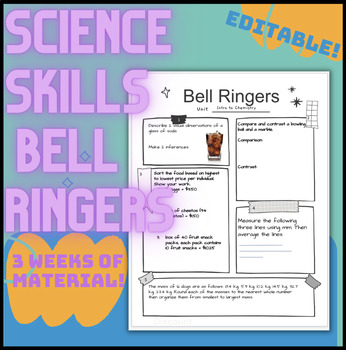
Science Skills Bell Ringers
3 weeks worth of bell ringers focused on basic science skills including determining variables, reading graphs and data tables, making observations and inferences, explaining your thinking, forming hypotheses, sorting information, averaging, measuring, compare and contrast, rounding data and creating a claim. Some questions are open ended and do not have a right/wrong answer, some do have correct answers. These bell ringers are best used with upper middle school through high school. Answer Key is
Subjects:
Grades:
7th - 12th
Types:
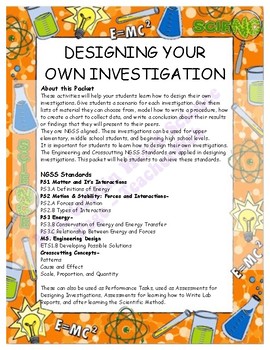
Designing Your Own Investigation-Free Preview!
These activities will help your students learn how to design their own investigations.
They are NGSS aligned. These investigations can be used for upper elementary, middle school students, and beginning high school levels.
It is important for students to learn how to design their own investigations. They can be used as Designing Investigations, Performance Tasks, Summative Assessments for Investigations or Explorations, or after learning the Scientific Method.
NGSS Standards
PS1, PS3.A, PS2,
Subjects:
Grades:
4th - 10th
Types:
Showing 1-9 of 9 results

