73 results
Measurement Common Core 6.SP.B.4 resources
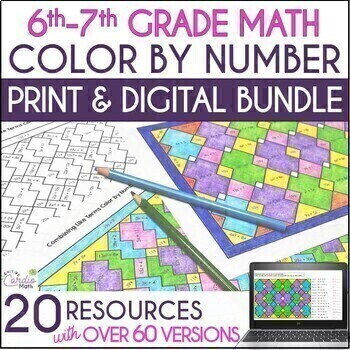
6th and 7th Grade Math Color by Number Probability, Inequalities Coloring Sheets
These 6th and 7th grade math coloring sheets and digital activities offer engaging practice for probability, volume, inequalities, percent of a number, adding and subtracting decimals, multiplying decimals, algebraic expressions and equations, equivalent expressions, inequalities, ratios and proportions, and more. These unique coloring sheets are so much more engaging than regular math worksheets.These color by number worksheets are self-checking - if the answer isn't on the sheets, students kno
Subjects:
Grades:
5th - 7th
Types:

Box and Whisker Plots Whodunnit Activity - Printable & Digital Game Options
Nothing like a good criminal investigation to liven up box and whisker plots! Based off my popular CSI projects, I have created Whodunnits? The Whodunnits plan to focus on single content topics as opposed to units and will focus more on skill building than application. Every day can't be a project day, so Whodunnits can be an engaging out of their seat activity to practice important skills. In a Whodunnit?, students will work in teams to solve 10 practice problems that increase in difficult. Aft
Subjects:
Grades:
7th - 12th
Types:
CCSS:
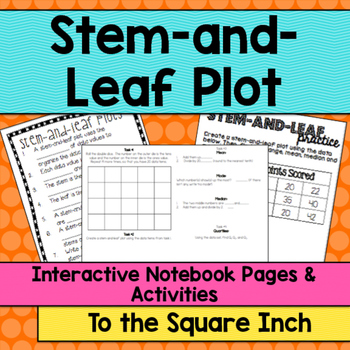
Stem and Leaf Plot Interactive Notebook
Stem-and-Leaf Plot No Prep Interactive Notebook Pages CCSS: 6.SP.B.4Included in this product: *Stem-and-Leaf Plot Guided Notes (2 per page)*Stem-and-Leaf Plot Problem (2 per page)*Stem-and-Leaf Plot Double Dice Practice Mini Book (give each student 2 dice if you don’t have double dice)*Answer KeysBox and Whisker Plot No Prep Interactive Notebook Pages Histograms No Prep Interactive Notebook Pages Looking for Mean Absolute Deviation Task Cards? Find them HERE Check out the Introduction to Statist
Subjects:
Grades:
5th - 8th
Types:
CCSS:
Also included in: Statistics and Graphing Data Notes, Activities and Projects

Stem and Leaf Plots Whodunnit Activity - Printable & Digital Game Options
Nothing like a good criminal investigation to liven up stem and leaf plots! Based off my popular CSI projects, I have created Whodunnits? The Whodunnits plan to focus on single content topics as opposed to units and will focus more on skill building than application. Every day can't be a project day, so Whodunnits can be an engaging out of their seat activity to practice important skills. In a Whodunnit?, students will work in teams to solve 10 practice problems that increase in difficult. After
Subjects:
Grades:
5th - 10th
Types:
CCSS:
Also included in: Pre-Algebra Whodunnit Activity Bundle - Printable & Digital Game Options
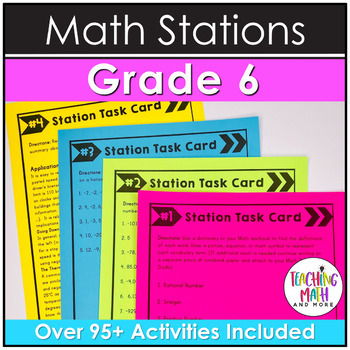
Math Stations 6th Grade Bundle | Math Centers Sixth Grade
This Middle School Math Station Bundle is a COMPLETE BUNDLE covering ALL 6th grade math skills and standards! These Math Station activities are easy to PRINT & GO and engage your students. A must-have set for any sixth grade Math teacher to start using math stations in their classroom or easily adaptable to any Math Stations program you already have!SAVE 30% when you buy the bundle!Easy to incorporate into your math workshops. Students will love learning and independently working at each mat
Subjects:
Grades:
6th
Types:
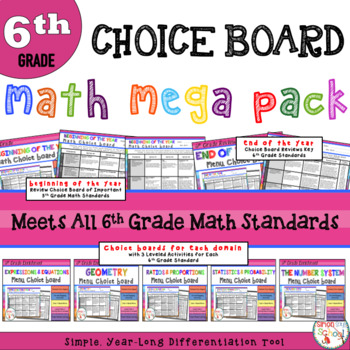
6th Grade Math Choice Board Mega Bundle - Year Long - Distance Learning
Math Choice Board Mega Pack – All 6th Grade Standards – Year Long – This choice board bundle is a simple, year-long differentiated tool for ALL 6th grade standards.This resource includes… - Math Choice Board Mega Pack – Year Long – All 6th Grade Standards - Expressions and Equations Enrichment Choice Board – Sixth Grade - Geometry Enrichment Choice Board – Sixth Grade - Ratios and Proportions Enrichment Choice Board – Sixth Grade - Statistics and Probability Enrichment Choice Boa
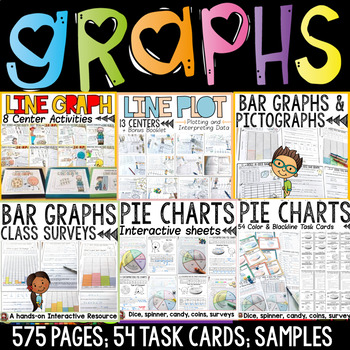
Bar Graphs Pictographs Line Graphs Line Plots Pie Charts Data Collection Bundle
The graphing bundle features interactive activities for creating and interpreting bar graphs, pictographs, line graphs, line plots and pie charts. Your entire graphing unit for a year!Separate folders featuring both British English and US spellings and terminology included.Great quality and value for this whopping 575 + page unit on graphing! Data is collected and interpreted using concrete materials such as visuals, dice, spinners, coins and other real-life objects and contexts. Further details
Subjects:
Grades:
2nd - 6th
Types:
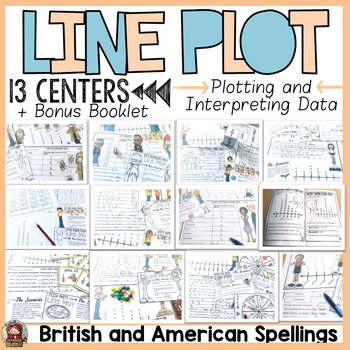
Line Plots With Fractions and Whole Numbers
Interpreting data in Line Plots with fractions and whole numbers feature 13 center interactive activities. Students will work with fractions of a unit and whole numbers to collate and display data using interactive materials like visual cards, dice, spinners, candy, coins, and other real-life data. Items Included13 center Activities (color and blackline): for each center activity students will follow the instructions on a task card to plot data on a line plot and interpret data plotted on a resp
Subjects:
Grades:
3rd - 7th
Types:
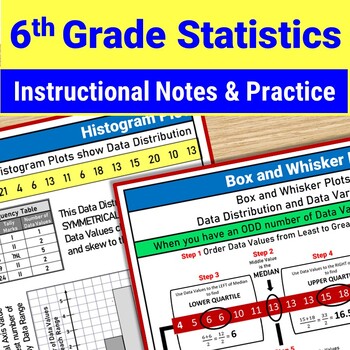
6th Grade Statistics Project Box Plot Mean Median Mode Range Histogram Activity
Teach all 6th Grade Statistics and Probability Standards with this 10-day Instructional Notes and Practice Unit. Calculate Measures of Central Tendency (mean, median, mode, range) and Mean Absolute Deviation. Master Data Display with Box and Whisker Plots, Histograms, Dot Plots, Stem and Leaf Charts. Write Statistical Questions. Analyze Data Distribution and Data Variability. No need to dread teaching 6th Grade Statistics because your textbook does a mediocre job of explaining how to calculate a
Subjects:
Grades:
6th - 8th
NGSS:
MS-ETS1-2
CSI: Data Analysis & Probability Activity - Printable & Digital Review Game
Nothing like a good criminal investigation to liven up data analysis and probability! In this project, students will work in teams to investigate the culprit of six fictional thefts. The criminal has left six messages, layered with algebra. Teams will work to build a case and present their findings to the court. Hopefully they are convincing enough to win the verdict.The puzzle solving hook causes many different students to engage in solving traditionally mundane problems. Be the cool teacher :-
Subjects:
Grades:
6th - 12th
Types:
Also included in: Probability & Expected Value Unit Bundle - Distance Learning Compatible

Line Plots Whodunnit Activity - Printable & Digital Game Options
Nothing like a good criminal investigation to liven up line plots! Based off my popular CSI projects, I have created Whodunnits? The Whodunnits plan to focus on single content topics as opposed to units and will focus more on skill building than application. Every day can't be a project day, so Whodunnits can be an engaging out of their seat activity to practice important skills. In a Whodunnit?, students will work in teams to solve 10 practice problems that increase in difficult. After each ans
Subjects:
Grades:
4th - 9th
Types:
Also included in: Pre-Algebra Whodunnit Activity Bundle - Printable & Digital Game Options
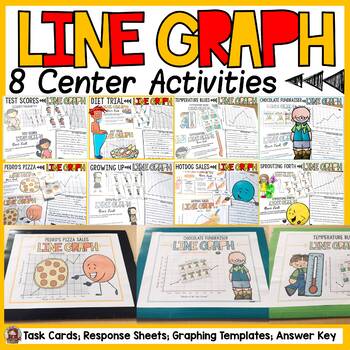
Line Graphs Center Activities
Have your students graph and interpret data in line graphs with these fun center interactive activities. There are 8 line graph center activities (blackline and color) in this pack. Students will collate, interpret and plot data in line graphs. Both British English and US spellings and terminology included.Items Included8 center Activities (color and blackline): for each center activity students will follow the instructions on a task card to plot data on a line graph and interpret data plotted o
Subjects:
Grades:
3rd - 6th
Types:
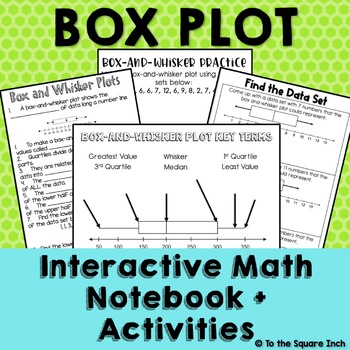
Box Plot Interactive Notebook
Box and Whisker Plot No Prep Interactive Notebook Pages CCSS: 6.SP.B.4Included in this product: *Box and Whisker Plot Guided Notes (2 per page)*Box and Whisker Plot Practice Problems (2 per page)*Box and Whisker Plot Directions (2 per page)*Box and Whisker Plot Vocabulary Practice (2 per page)*Find the Data Set Practice (2 per page)*Box-and-Whisker Plot Double Dice Practice Mini Book (give each student 2 dice if you don’t have double dice)*Box-and-Whisker Plot Data Collection Activity Mini Book*
Subjects:
Grades:
5th - 8th
Types:
CCSS:
Also included in: Statistics and Graphing Data Notes, Activities and Projects
Math Stations Middle School Bundle
Do your students love independent math stations? These math stations are great for practice and math skills review. A COMPLETE MIDDLE SCHOOL BUNDLE covering all 6th, 7th, & 8th grade math standards! There is NO PREP needed. Just print each math station activity and go teach today! Easy to incorporate into your math workshops. Students will love learning and independently working at each math station. All math skills are covered in the middle school math stations. Here's what you'll get: 44 M
Subjects:
Grades:
6th - 8th
Types:
Line Plot Fractions Video Game Lesson/Distance Learning Project; 4th , 5th, 6th
Printable and digital lesson/project for 4.MD.B2 and 5.MD.B2: (Grades 4, 5 ,6) Get students excited about analyzing data! Give them a reason to WANT to calculate an average and add and subtract fractions on a line plot! This Fortnite mini unit has students determining the most FULL LIVES (wholes) they can make from fractional parts. They can also determine the average and practice creating, analyzing and performing operations with fraction numbers on a variety of line plots.This mini-unit also
Subjects:
Grades:
4th - 6th
Types:
6th Grade Math Statistics and Probability Curriculum Unit CCSS Aligned
This 5 lesson CCSS aligned Statistics and Probability Unit includes a full set of lessons/guided notes that cover all of the statistics 6th grade standards as well as an assessment and study guide. Topics included are statistical questions, measures of center and mode (mean, median, range, and mean absolute deviation), dot plots, histograms, and box and whisker plots. This unit has all instructional lessons needed to cover and teach the 6th grade statistics and probability standards to your stud
Subjects:
Grades:
6th
Also included in: 6th Grade Math Curriculum CCSS Aligned Bundle
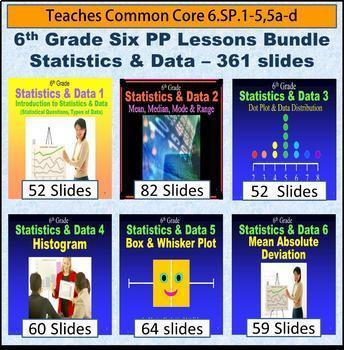
6th Grade Statistics & Data Bundle - 6 Powerpoint Lessons - 402 Slides
Sixth Grade Statistics and Data Bundle - It is composed of 6 different lessons comprising 402 slides on the following: Statistics and Data 1 - Statistical Questions and Types of Data, Statistics and Data 2 - Mean, Median, Mode & Range, Statistics and Data 3 - Dot Plot and Data Distribution, Statistics and Data 4 - Histogram, Statistics and Data 5 - Box and Whisker Plot, Statistics and Data 6 - Mean Absolute Deviation. For more information on these powerpoint lesson click on the individu
Subjects:
Grades:
6th
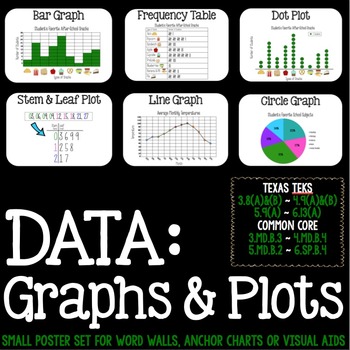
Math Vocabulary: Stem & Leaf, Dot Plots, Frequency Tables
This small poster set (each print out is 6.5 x 9.5) includes visual examples for:
- Bar Graph
- Frequency Plot
- Stem and Leaf Plot
- Circle Graph
- Line Graph
- Dot Plot
Great for word walls, anchor charts or visual aids in your classroom!
Subjects:
Grades:
3rd - 6th
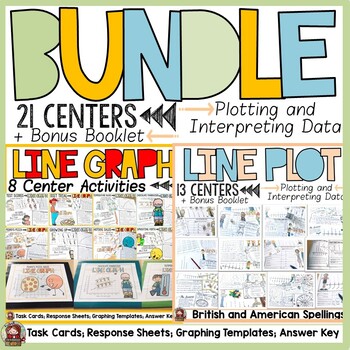
Line Graphs and Line Plots With Fractions and Whole Numbers Centers Bundle
Line Graphs and Line Plots with fractions and whole numbers feature interactive center activities. Data is collected using concrete materials such as visuals, dice, spinners, coins and other real-life objects and contexts. Further details about the graphs featured in this bundle are:1. LINE GRAPHSThis is a 145 page unit on Line Graphs that contains visual interactive activities to collate, record and interpret data in line graphs. Items Included8 center Activities (color and blackline): for eac
Subjects:
Grades:
3rd - 7th
Types:
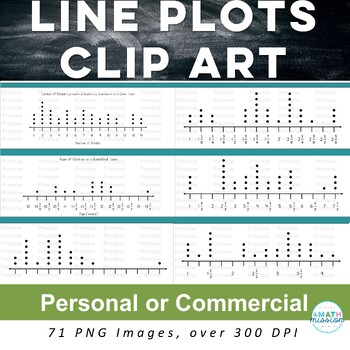
Math Line Plots Dot Plots Clip Art for Personal and Commercial Use
These clip art line plots will make creating your own resources so much quicker for both personal and commercial use. I created these to be used in my own resources and knew they could save another teacher tons of time. There are 71 total pieces of clip art, all black and white, with transparent background and over 300 dpi. Included are:10 titled line plots11 titled line plots with some numbers missing on the number line16 line plots with no titles12 line plots with no titles and some numbers
Subjects:
Grades:
3rd - 6th
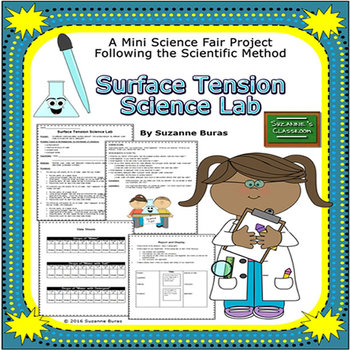
Mini Science Fair Project: Surface Tension Lab
This product was created for a classroom science lab designed to be used to introduce students to the scientific method and to doing a "real" Science Fair Project. It includes all parts of the scientific method and the Science Fair components. The experiment includes a blank lab sheet, detailed, step-by-step instructions for completing the lab, a data sheet, instructions for writing a science report, lab "slips" for grading participation in the lab, and an diagram for helping to set up a displa
Subjects:
Grades:
4th - 6th
Also included in: Scientific Method Bundle
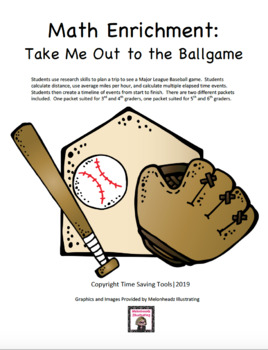
Take Me Out to the Ballgame: Baseball Math Enrichment Project
This is a real world enrichment project for those students who need some deeper work in mathematics. Students will use a variety of skills to complete this project including, research skills, elapsed time skills, measurement skills, and higher level thinking skills. This is a great way to provide differentiation in the classroom. There is a 3rd/4th grade packet and a 5th/6th grade packet included. This is great for gifted and talented students. It also can be a great family activity to work
Subjects:
Grades:
3rd - 6th
6th Grade Statistics & Data 5 - Box and Whisker Plot Powerpoint Lesson
Sixth Grade Statistics 5 - Box and Whisker Plot Powerpoint Lesson is powerful when used as direct instruction in the classroom, online or individually. It teaches students all the skills necessary to make a box and whisker plot: mean, median, lower quartile Q1, upper quartile Q3, inter quartile range, range, minimum and maximum numbers. Students then are shown how to take this information and build a box and whisker plot. Finally, students are taught how to analyze the box and whisker plot th
Subjects:
Grades:
6th, Adult Education
Also included in: 6th Grade Statistics & Data Bundle - 6 Powerpoint Lessons - 402 Slides
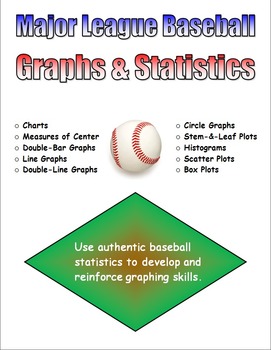
Major League Baseball Graphs & Statistics (Updated with 2013 Statistics)
Use authentic baseball statistics to develop and reinforce Common Core standards related to graphs and statistics!
Analyze, chart, and graph the World Series participants over the last one hundred years, the 1998 Atlanta Braves starting pitchers, the Big Red Machine of the 1970's, Rickey Henderson's electrifying 1982 season, the Great Homerun Chase of 1998 between Mark McGwire and Sammy Sosa, the overall success of MLB's newest franchises in Seattle, Colorado, and Miami, "Stan-the-Man" Musial's
Subjects:
Grades:
5th - 8th
Types:
CCSS:
Showing 1-24 of 73 results


