
Data Management Unit: Reading Graphs Collecting & Analyzing Data Grade 6 Ontario


- PDF
- Google Apps™

What educators are saying
Also included in
 "This is the best resource available for Ontario math teachers!" This comprehensive, EDITABLE math program covers Coding, Financial Literacy, Number Sense, Operations, Pattering, Algebra, Geometric Reasoning, Measurement, Location & Movement. It includes engaging Google Slides lessons, hands-onPrice $115.00Original Price $218.00Save $103.00
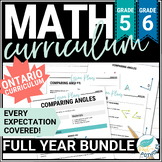 How would it feel to have ALL your math planned for the year? Get comprehensive, EDITABLE math units that cover ALL EXPECTATIONS of grade 5 AND grade 6 Ontario Math Curriculum - engaging lessons, hands-on activities, worksheets, math centre task cards, games, assessments.Students will learn to use aPrice $175.00Original Price $350.00Save $175.00
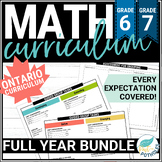 Ontario teachers love these math units. You'll have access to our best resources for SEL First 20 Days, Numbers, Operations, Patterning, Algebra, Coding, Geometry, Location and Movement, Measurement, and Financial Literacy. These user-friendly, comprehensive, and EDITABLE Ontario math units cover ALPrice $180.00Original Price $386.50Save $206.50
Description
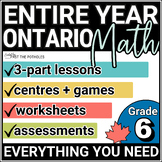
Save time and reduce stress!! This UPDATED Grade 6 Ontario Math Data Literacy unit has EVERYTHING YOU NEED. Students will learn about reading graphs, collecting data, analyzing data, misleading graphs, averages, and more. It includes 3-part Google Slides lessons, worksheets, games, centres, assessments, and report card comments.
New histograms, broken-line graphs and infographic content are included with data analysis and data collection!
SPECIFIC LESSON TOPICS:
✓ Discrete and Continuous Data
✓ Collecting Data
✓ Displaying Data using appropriate graphs - broken-line graphs
✓ Creating an Infographic
✓ Ranges and Averages - Measures of Central Tendency - mean, median, mode
✓ Misleading Graphs
✓ Analyzing Data in histograms and broken-line graphs
This Data Management Unit is INCLUDED in our huge bundle of grade 6 math units. Take a look!!
ABOUT THE GRADE 6 ONTARIO DATA MANAGEMENT UNIT
✪ Everything is fully EDITABLE (just make a copy)
✪ Lessons and activities use research-based best practices
✪ In-person and digital options for face-to-face and distance learning
✪ Text isn't locked to allow text-to-speech software for student accommodations
✪ Pages are set to 8.5x11 for easy printing
✪ Almost all files are Google Slides files with PDF versions
This is NOT a collection of print-and-go worksheets! Students will collaborate and problem-solve their way to a deeper understanding of math concepts while enjoying your math class!
WHAT’S INCLUDED?
⇧ See the detailed PREVIEW to get a clear idea of what to expect with your purchase ⇧
✔ Teacher guide for the unit
✔ Expectations chart in student-friendly language
✔ 8 3-part math lessons
✔ Any needed blackline masters for lessons
✔ 4 Balanced Math Centres
✔ Vocabulary package: glossary pages and Math Word Wall cards
✔ 1 concept page for student notebooks and/or open-ended assessment
✔ Final unit test with answer key
✔ Culminating Assignment for additional meaningful assessment
✔ Assessment guide with math notebook success criteria and learning goals
TIPS FOR USE
✏️ Present Google Slides lesson to the class and have partners work collaboratively through the tasks
✏️ Keep the presenter notes open on YOUR computer screen to follow along with slides
✏️ Share A COPY of the Google Slides in your online classroom for virtual learning
✏️ Combine Data Management with Media Literacy while teaching Infographics!
FAQs
Q: Is this unit aligned with the new Ontario Math Curriculum from 2020?
A: Yes! It has now been fully updated to reflect the curriculum changes.
Q: Does this Data Literacy unit include mean, median and mode?
A: Yes it does. They are included in Lesson 6: Ranges and Averages.
WHAT TEACHERS ARE SAYING
⭐⭐⭐⭐⭐ “Very useful resource for teaching the revised data strand. Thank you so much, I found it very helpful.” - Noreen
⭐⭐⭐⭐⭐ “This was a great addition to our data unit. I love to see that it has recently been updated for future use!” - Jenna
⭐⭐⭐⭐⭐ “My students really enjoyed this resource. It was super easy to use!” - Eric
PLEASE NOTE
⚡This is a GOOGLE DRIVE product. The download includes the cover page and teacher pages, with a link and instructions to a Google Drive folder containing all other included files. If you don't have Google Drive, it is free and easy to sign up! ⚡
♻ We strive to be environmentally conscious by creating digital products. Please don't print more than is necessary!
YOU MIGHT ALSO LOVE…
Complete set of math report card comments? We have that!
Ontario Math Report Card Comments – grade 6
All other grade 6 math units are also available:
A - Introducing Math (First 2 Weeks)
E1 - Location and Movement (Geometry)
Rates and Ratios (not aligned with 2020 curriculum)
Mental Math (not aligned with 2020 curriculum)
Extra Practice
Reasoning and Proving - student activity
Math About Me activity - perfect for start of the year, review, assessment or reflection
Math Scavenger Hunt - perfect for a fun review activity
▼▼▼▼▼▼▼▼▼▼▼▼▼▼▼▼▼▼▼▼▼▼▼▼▼▼▼▼▼▼▼▼▼▼▼▼▼▼▼▼▼▼▼▼▼▼▼▼▼▼▼▼▼▼▼▼▼▼▼▼▼▼▼▼▼▼▼▼▼▼▼▼
If you like this product don’t forget to leave ⭐⭐⭐⭐⭐ FEEDBACK. Not only does it help others find it, but you also EARN CREDITS towards future purchases!
______________________________________________________________________________
Join our MAILING LIST for product notifications, freebies and updates straight into your mailbox!!
Discover teaching tips and strategies to support our resources over at the blog: www.pastthepotholes.com/teaching
TERMS OF USE - © Past The Potholes Ltd.
This item is a paid digital download from my TpT store: www.teacherspayteachers.com/Store/Past-The-Potholes
It is for personal use in one classroom only. Copies are only allowed for your own classroom use.
This item is bound by copyright laws. Redistributing, editing, selling, or posting this item (or any part thereof) on the internet are all strictly prohibited without first gaining permission from the author. Violations are subject to the penalties of the Digital Millennium Copyright Act.
