6 results
Geography Common Core 6.SP.B.4 resources
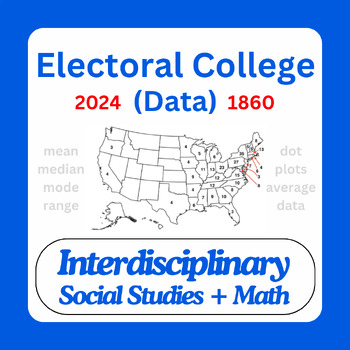
Electoral College Data Analysis – An Interdisciplinary Look at 2024 and 1860
This multi-discipline resource combines two topics often misunderstood, the US Electoral College system, and dot plots, in order to provide critical practice in finding and analyzing averages, mean, median, mode, and range. Students start with a “Notice – Wonder” look at a dot plot displaying state Electoral College votes for the 2024 US Presidential Election. Students then practice calculating measures of central tendency and then analyzing their findings. Students then look at the makeup of th
Subjects:
Grades:
5th - 12th, Higher Education, Adult Education
Types:
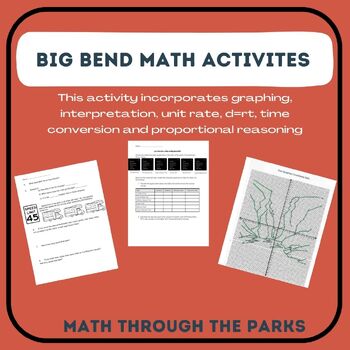
Big Bend Math: Graphing, Converting time, D=Rt, Unit Rate & Coordinate Graph
Hiking Big BendThis activity incorporates the following skills:· Converting minutes to hours and hours to minutes· Unit rate· Graphing and Interpreting· Unit Rate· D=RT· Real world application· Proportional Reasoning Calculating Distance Based on teacher preference you can answer for answers in hours and minutes or just minutes. The answer sheet includes both answers. Also, you can access the actual Big Bend map on the NPS website. This activity incorporates the following skills:· Converting m
Subjects:
Grades:
6th - 8th
Types:
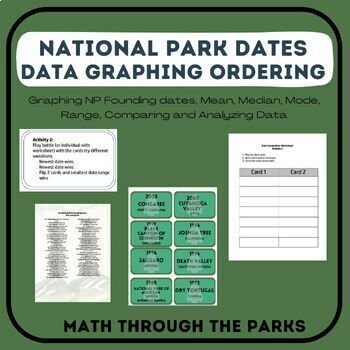
US National Park Founding Dates Graphing and Analyzing Data
Math is everywhere. This activity takes us into the founding dates of the US National Parks. The students will graph and analyze data of the dates. This includes multiple activities that can be use in various environments in the classroom. This activity includes the following concepts.· Order sets of real numbers arising in mathematical real-world contexts· Extent previous knowledge of sets and subsets using the visual representation to describe relationships between sets of real numbers.· MMMR
Subjects:
Grades:
6th - 8th
Types:
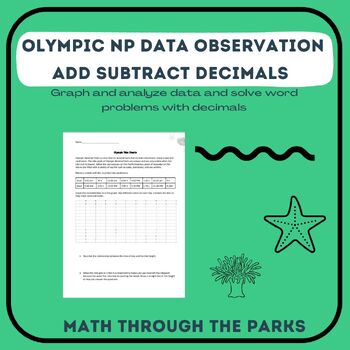
Olympic National Park Tide Charts: Graphing, Interpreting, and Decimals
Olympic National Park has daily predicted tide charts for their beaches. The goal of this activity is to graph the data and make predictions based on the graph. Questions incorporate understand of time, adding and subtracting decimals, and even averages. There is also a create your own question part of for this activity where the student can use current data to create questions.
Subjects:
Grades:
6th - 8th
Types:
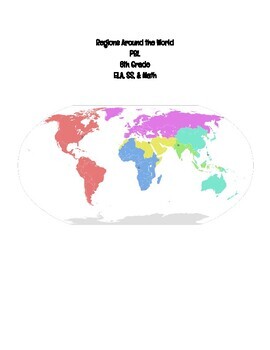
Regions Around the World PBL
Integrating the content areas of ELA, SS, and Math, the general idea of this project is for students to read a novel that is focused on one of the 8 regions and identify a problem in the book. Students will then work to create a product or service to solve the problem identified. Students then work within their collaborative groups to create a jigsaw puzzle based off of the 5 pieces of criteria for world regions. This product includes rubrics for the ELA, SS, and math requirements. The math port
Subjects:
Grades:
5th - 8th
Types:
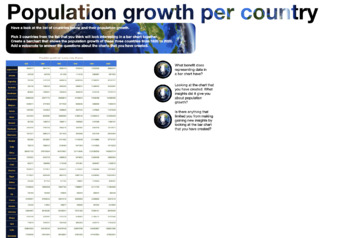
Population Growth interactive Numbers workbook
In this interactive workbook students will learn how to create different kind of charts from data tables around the topic of world population growth. First they will guess the total number of people living on earth and draw where in the world they are living. Secondly we look at adding columns to a table and adding a simple sum function to calculate the total number of people living on earth over a period of 120 years. This column we will then plot on a line graph. This lesson also covers: Bar c
Grades:
6th - 9th
Types:
Showing 1-6 of 6 results


