23 results
Statistics independent work packets for Microsoft PowerPoint

MEANS AND VARIANCES OF A RANDOM VARIABLE
Means and Variances of a Random VariableIn this lesson, students will learn:▪ how to apply the rules for sums or differences of means of two separate distributions or repeated trials from a single distribution▪ how to apply the rules for sums or differences of variances of two separate distributions or repeated trials from a single distribution
Subjects:
Grades:
10th - 12th, Higher Education
KEY | MEANS AND VARIANCES OF A RANDOM SAMPLE
Means and Variances of a Random VariableIn this lesson, students will learn:▪ how to apply the rules for sums or differences of means of two separate distributions or repeated trials from a single distribution▪ how to apply the rules for sums or differences of variances of two separate distributions or repeated trials from a single distribution
Subjects:
Grades:
10th - 12th, Higher Education
KEY | How Does Stratifying Improve on a Simple Random Sample?
How Does Stratifying Improve on a Simple Random Sample? In this lesson, students will learn:what is meant by an unbiased estimator or statistichow to simulate a simple random samplehow to simulate a sample proportionhow to simulate a stratified random sample.the difference between bias and variation.
Subjects:
Grades:
10th - 12th, Higher Education

Do Heavier Cars Use More Gasoline?
In this lesson, students will learn:to create a scatterplot and a linear regression line on a graphing calculator.to assess how linear the data points are and how useful a linear regression will be.to create and interpret a residual plot.to make predictions using the regression line, distinguishing between extrapolations and interpolation
Subjects:
Grades:
10th - 12th, Higher Education

ARE ALTITUDE AND PRECIPITATION INDEPENDENT?
In this lesson, students will learn:to create and interpret a two-way tableto calculate "or" probabilities, "and" probabilities, or conditional probabilities— the "given" type, by reading a two-way table, or by applying one of the basic probability formulas.to viscerally decide if two events are independent--viscerally because they have not yet learned the Chi-square test of independence.
Subjects:
Grades:
10th - 12th, Higher Education

How Much TV Do College Students Watch?
In this lesson, students will learn:how to perform all the steps of a confidence intervalhow to perform all the steps of a significance testhow to predict the outcome of a two-tailed significance test by using the corresponding confidence interval
Subjects:
Grades:
10th - 12th, Higher Education
How Does Stratifying Improve on a Simple Random Sample?
How Does Stratifying Improve on a Simple Random Sample?In this lesson, students will learn:what is meant by an unbiased estimator or statistichow to simulate a simple random samplehow to simulate a sample proportionhow to simulate a stratified random sample.the difference between bias and variation.
Subjects:
Grades:
10th - 12th, Higher Education
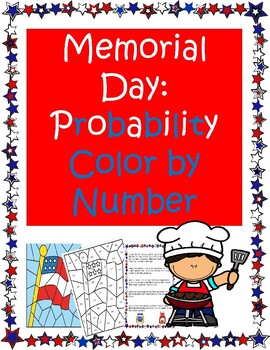
Memorial Day Probability Color by Number
In this activity, students are asked to find the probability that people at a cookout get the type of burger they want, then they are asked to find their answer on a color by number sheet. The colored picture is a flag -- great for Memorial Day and for math review in general.Product can be given for homework, independent practice or enrichment. Great for GED learners, Special Education students, and those needing an end-of-the-year review of probability.Fun exercise!No prep exercise. Answer K
Subjects:
Grades:
7th - 8th, Adult Education

KEY | Do Heavier Cars Use More Gasoline?
In this lesson, students will learn:to create a scatterplot and a linear regression line on a graphing calculator.to assess how linear the data points are and how useful a linear regression will be.to create and interpret a residual plot.to make predictions using the regression line, distinguishing between extrapolations and interpolation
Subjects:
Grades:
10th - 12th, Higher Education

KEY | ARE ALTITUDE AND PRECIPITATION INDEPENDENT?
In this lesson, students will learn:to create and interpret a two-way tableto calculate "or" probabilities, "and" probabilities, or conditional probabilities— the "given" type, by reading a two-way table, or by applying one of the basic probability formulas.to viscerally decide if two events are independent--viscerally because they have not yet learned the Chi-square test of independence.
Subjects:
Grades:
10th - 12th, Higher Education

KEY | How Much T.V. Do College Students Watch?
In this lesson, students will learn:how to perform all the steps of a confidence intervalhow to perform all the steps of a significance testhow to predict the outcome of a two-tailed significance test by using the corresponding confidence interval
Subjects:
Grades:
10th - 12th, Higher Education
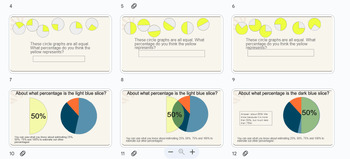
Estimating Percentages 2: Circle Graphs POWERPOINT
This mathematics PowerPoint resource is intended to support learners working on Virginia Standard of Learning:6.NS.1 a)Estimate and determine the percent represented by a given model (e.g., number line, picture, verbal description), including percents greater than 100% and less than 1%. This material was development for 1:1 review and tutoring. Teachers may find it useful for younger learners and students receiving special/exceptional education as well as with students learning in states other t
Subjects:
Grades:
4th - 6th

Baseball Salaries! | Answer Key
Answer Key for Baseball Salaries!
Subjects:
Grades:
10th - 12th, Higher Education
Estimating Percentages: 25%, 50%, 75%, 100% POWERPOINT
This mathematics Slide Deck resource is intended to support learners working on Virginia Standard of Learning:6.NS.1 a)Estimate and determine the percent represented by a given model (e.g., number line, picture, verbal description), including percents greater than 100% and less than 1%. This material was development for 1:1 review and tutoring. Teachers may find it useful for younger learners and students receiving special/exceptional education as well as with students learning in states other t
Subjects:
Grades:
4th - 6th
Advanced compound probability presentation (editable) - AC Year 9 Maths
This product is compliant with Australian Curriculum version 8.4 and version 9.DescriptionThis presentation helps students extend compound probability concepts to include dependence and replacement to model more sophisticated and complex scenarios in probability. This is suitable for the teaching and learning of Australian Curriculum Year 9 Mathematics (Statistics and Probability) (v8.4/v9).Buying this presentation will save you around 3 hours of time creating it.This is the editable version, al
Subjects:
Grades:
8th - 10th
Probability review presentation (editable) - AC Year 9 Maths - Probability
This product is compliant with Australian Curriculum version 8.4 and version 9.DescriptionThis presentation helps students review essential probability learning from previous years' maths classes. This is suitable for the teaching and learning of Australian Curriculum Year 9 Mathematics (Statistics and Probability) (v8.4/v9).Buying this presentation will save you around 3 hours of time creating it.This is the editable version, allowing you to change and modify the task as you like it. Please res
Subjects:
Grades:
8th - 10th
Probability review presentation - AC Year 9 Maths - Statistics and Probability
This product is compliant with Australian Curriculum version 8.4 and version 9.DescriptionThis presentation helps students review essential probability learning from previous years' maths classes. This is suitable for the teaching and learning of Australian Curriculum Year 9 Mathematics (Statistics and Probability) (v8.4/v9).Buying this presentation will save you around 3 hours of time creating it.SequencingBefore this task: students must interconvert between fractions, decimals and percentages,
Subjects:
Grades:
8th - 10th
Compound probability presentation (editable) - AC Year 9 Maths - Probability
This product is compliant with Australian Curriculum version 8.4 and version 9.DescriptionThis presentation helps students explore and understand the formalisms in compound probability concepts, including the application of Boolean logic and various types of diagrams to explain compound probability experiment sample spaces. This is suitable for the teaching and learning of Australian Curriculum Year 9 Mathematics (Statistics and Probability) (v8.4/v9).Buying this presentation will save you aroun
Subjects:
Grades:
8th - 10th
Probability Slides and Notes
Check out this set of probability stations- your students will love learning about probability and conditional probability exhibition style! Students can travel from station to station - OR- you can print smaller versions and have the students use the cards as independent centers - OR- you can display the powerpoint slides at individual stations. Student response sheet helps guides students through their learning. Best of all they are learning on their own, and you can skip the lecture! Incl
Subjects:
Grades:
9th - 12th
CCSS:
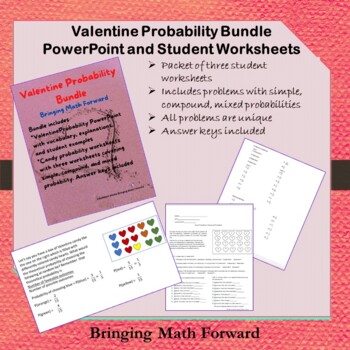
Valentine Probability Bundle (distance learning)
This bundle includes two resources. The first is a PowerPoint on probability which covers vocabulary and simple and compound probability. The second is a packet of three worksheets which cover the same topics; the worksheets all contain unique problems and answer keys are included.
Subjects:
Grades:
6th - 8th
Advanced compound probability presentation - AC Year 9 Maths - Probability
This product is compliant with Australian Curriculum version 8.4 and version 9.DescriptionThis presentation helps students extend compound probability concepts to include dependence and replacement to model more sophisticated and complex scenarios in probability. This is suitable for the teaching and learning of Australian Curriculum Year 9 Mathematics (Statistics and Probability) (v8.4/v9).Buying this presentation will save you around 3 hours of time creating it.SequencingBefore this task: stud
Subjects:
Grades:
8th - 10th
Compound probability presentation - AC Year 9 Maths - Statistics and Probability
This product is compliant with Australian Curriculum version 8.4 and version 9.DescriptionThis presentation helps students explore and understand the formalisms in compound probability concepts, including the application of Boolean logic and various types of diagrams to explain compound probability experiment sample spaces. This is suitable for the teaching and learning of Australian Curriculum Year 9 Mathematics (Statistics and Probability) (v8.4/v9).Buying this presentation will save you aroun
Subjects:
Grades:
8th - 10th

Baseball Salaries! | Comparing 2 or More Numerical Distributions
Suppose you want to compare two or more numerical distributions. The best way to do this is by creating parallel boxplots. This lesson accomplishes this with explicit TI-84 keystroke instructions. In addition to learning how to construct parallel boxplots on a graphing calculator, students will additionally learn the following from participation in this activity:· the relationship between a boxplot and its corresponding histogram.· how to distinguish right skewness from left skewness using onl
Subjects:
Grades:
10th - 12th, Higher Education
Showing 1-23 of 23 results


