
Math Mystery Puzzles: Data Displays


- Google Sheets™
- Internet Activities

Products in this Bundle (5)
Bonus
Also included in
 This self-correcting mystery puzzle is in Google Sheets. As students enter the correct answers the picture reveals itself. Box is red if the answer is wrong and green if the answer is correct - along with a puzzle piece reveal.This puzzle is an extension to 6th Grade Big Ideas, Notes and Homework, CPrice $74.25Original Price $82.50Save $8.25
Description
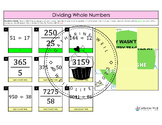
This self-correcting mystery puzzle is in Google Sheets. As students enter the correct answers the picture reveals itself. Box is red if the answer is wrong and green if the answer is correct - along with a puzzle piece reveal.
This puzzle is an extension to Ch 10: Data Displays, Notes and Homeworkand Ch 10: Data Displays, Skill Check
*Fun and engaging
*Great for review
*Self-correcting
*Thank you LindsayBowden.com for the template!*
You May Also Be Interested In:
6th Grade Big Ideas, Notes and Homework
6th Grade, Big Ideas, Skill Checks
Math Mystery Pictures: Numerical Expressions & Factors
Math Mystery Pictures: Fractions and Decimals
Math Mystery Puzzles: Percents
Common Assessment Student Data Tracker
Journeys Spelling and Grammar Tests
❤️ Thank You! ❤️
I really appreciate your interest in my product! As I'm working hard to continue to grow my TPT store and business, it would mean so much to me if you left a kind review and rating after purchasing a product (or freebie!) If you have any questions about this resource, you're welcome to reach out!
⭐️ Follow Me to get updates on new products and freebies coming soon!! ⭐️
Terms of Use: This product should only be used by the teacher who purchased it. This product is not to be shared with other teachers. Please buy the correct number of licenses if this is to be used by more than one teacher.
