38 results
High school statistics independent work packet microsofts

MEANS AND VARIANCES OF A RANDOM VARIABLE
Means and Variances of a Random VariableIn this lesson, students will learn:▪ how to apply the rules for sums or differences of means of two separate distributions or repeated trials from a single distribution▪ how to apply the rules for sums or differences of variances of two separate distributions or repeated trials from a single distribution
Subjects:
Grades:
10th - 12th, Higher Education
KEY | MEANS AND VARIANCES OF A RANDOM SAMPLE
Means and Variances of a Random VariableIn this lesson, students will learn:▪ how to apply the rules for sums or differences of means of two separate distributions or repeated trials from a single distribution▪ how to apply the rules for sums or differences of variances of two separate distributions or repeated trials from a single distribution
Subjects:
Grades:
10th - 12th, Higher Education
KEY | How Does Stratifying Improve on a Simple Random Sample?
How Does Stratifying Improve on a Simple Random Sample? In this lesson, students will learn:what is meant by an unbiased estimator or statistichow to simulate a simple random samplehow to simulate a sample proportionhow to simulate a stratified random sample.the difference between bias and variation.
Subjects:
Grades:
10th - 12th, Higher Education

Do Heavier Cars Use More Gasoline?
In this lesson, students will learn:to create a scatterplot and a linear regression line on a graphing calculator.to assess how linear the data points are and how useful a linear regression will be.to create and interpret a residual plot.to make predictions using the regression line, distinguishing between extrapolations and interpolation
Subjects:
Grades:
10th - 12th, Higher Education

ARE ALTITUDE AND PRECIPITATION INDEPENDENT?
In this lesson, students will learn:to create and interpret a two-way tableto calculate "or" probabilities, "and" probabilities, or conditional probabilities— the "given" type, by reading a two-way table, or by applying one of the basic probability formulas.to viscerally decide if two events are independent--viscerally because they have not yet learned the Chi-square test of independence.
Subjects:
Grades:
10th - 12th, Higher Education

How Much TV Do College Students Watch?
In this lesson, students will learn:how to perform all the steps of a confidence intervalhow to perform all the steps of a significance testhow to predict the outcome of a two-tailed significance test by using the corresponding confidence interval
Subjects:
Grades:
10th - 12th, Higher Education
How Does Stratifying Improve on a Simple Random Sample?
How Does Stratifying Improve on a Simple Random Sample?In this lesson, students will learn:what is meant by an unbiased estimator or statistichow to simulate a simple random samplehow to simulate a sample proportionhow to simulate a stratified random sample.the difference between bias and variation.
Subjects:
Grades:
10th - 12th, Higher Education

KEY | Do Heavier Cars Use More Gasoline?
In this lesson, students will learn:to create a scatterplot and a linear regression line on a graphing calculator.to assess how linear the data points are and how useful a linear regression will be.to create and interpret a residual plot.to make predictions using the regression line, distinguishing between extrapolations and interpolation
Subjects:
Grades:
10th - 12th, Higher Education

KEY | ARE ALTITUDE AND PRECIPITATION INDEPENDENT?
In this lesson, students will learn:to create and interpret a two-way tableto calculate "or" probabilities, "and" probabilities, or conditional probabilities— the "given" type, by reading a two-way table, or by applying one of the basic probability formulas.to viscerally decide if two events are independent--viscerally because they have not yet learned the Chi-square test of independence.
Subjects:
Grades:
10th - 12th, Higher Education

KEY | How Much T.V. Do College Students Watch?
In this lesson, students will learn:how to perform all the steps of a confidence intervalhow to perform all the steps of a significance testhow to predict the outcome of a two-tailed significance test by using the corresponding confidence interval
Subjects:
Grades:
10th - 12th, Higher Education
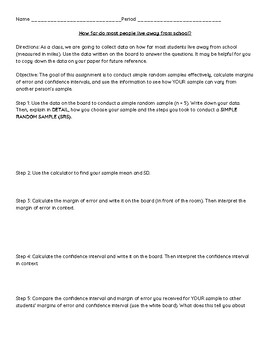
Margin of Error and Confidence Intervals Class Activity: Statistics
Hi! If you're looking for an interactive class activity on margin of error and confidence intervals, this is a fun and engaging 1-2 hour long activity you can do with your student. It will require students to collect data and use the data to create their own confidence intervals. Feel free to edit the document as you need. I've used this assignment as an open quiz/class quiz and/or exit ticket before. Please do not distribute or post this resource publicly. Thank you!
Subjects:
Grades:
10th - 12th
CCSS:

Baseball Salaries! | Answer Key
Answer Key for Baseball Salaries!
Subjects:
Grades:
10th - 12th, Higher Education

Creating Surveys and Analyzing Data, In-Class Activity
This activity walks students through the process of creating a survey, collecting results, and analyzing data. It is an assignment that can be done independently by students in class. Students that have any difficulty should be able to easily get assistance from fellow students. Rather than simply learning the terminology that comes with surveys and collecting research data, the student will use critical thinking to create and analyze their own surveys.
Subjects:
Grades:
10th - 12th, Higher Education
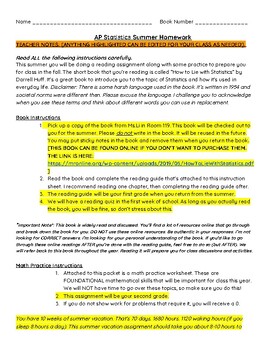
AP Statistics Summer Homework Packet: How to Lie with Statistics by Darrell Huff
Hello! This is a summer homework packet for AP Statistics. The homework consists of two parts: Guided reading questions for the book "How to Lie with Statistics" by Darrell Huff and a foundational math practice portion (it's review for basic math skills that will be used in AP Statistics). There are examples with solutions included in the math portion. If you don't have a physical copy of the book, I attached a free digital copy to the document. The packet is editable, so you may make changes t
Subjects:
Grades:
11th - 12th

Using Desmos to find statistics, make graphs, and linear regression - self guide
This is a digital resource that guides students through finding statistics (mean, median), making graphs (histograms, dotplots, boxplots, and scatterplots) and writing the equation of the line of best fit using Desmos.
Subjects:
Grades:
8th - 9th
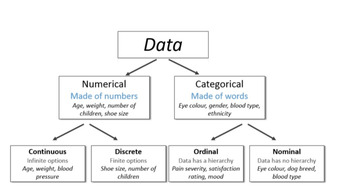
Types of Data
This is a word document that students can work through independently on types of data (Numerical Discrete & Continuous, Categorical Nominal & Ordinal) It provides note, worked examples and practice questions on classifying data, the reliability of data and classifying as data as either primary or secondary.
Subjects:
Grades:
6th - 9th
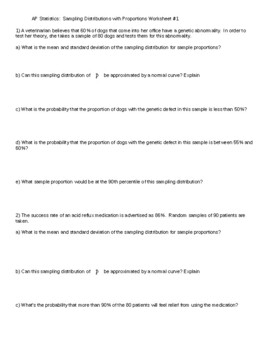
Sampling Distributions With Proportions Worksheet #1
14 question, free-response style worksheet over sampling distributions of p-hat. All original material, not CHEGG-able!! Key Included
Subjects:
Grades:
9th - 12th
Also included in: Confidence Intervals with Proportions Unit
Advanced compound probability presentation (editable) - AC Year 9 Maths
This product is compliant with Australian Curriculum version 8.4 and version 9.DescriptionThis presentation helps students extend compound probability concepts to include dependence and replacement to model more sophisticated and complex scenarios in probability. This is suitable for the teaching and learning of Australian Curriculum Year 9 Mathematics (Statistics and Probability) (v8.4/v9).Buying this presentation will save you around 3 hours of time creating it.This is the editable version, al
Subjects:
Grades:
8th - 10th
Probability review presentation (editable) - AC Year 9 Maths - Probability
This product is compliant with Australian Curriculum version 8.4 and version 9.DescriptionThis presentation helps students review essential probability learning from previous years' maths classes. This is suitable for the teaching and learning of Australian Curriculum Year 9 Mathematics (Statistics and Probability) (v8.4/v9).Buying this presentation will save you around 3 hours of time creating it.This is the editable version, allowing you to change and modify the task as you like it. Please res
Subjects:
Grades:
8th - 10th

Sports Statistics - Explore Statistics through sports
Activity that gets students thinking about statistics and the context needed to fully understand them."Fill out the following worksheet / activity based around sports statistics. You are going to choose any 1 sports statistics (completion percentage, 3pt percentage, ERA, batting average, xG, pressures per 90, record, etc.) and answer questions about it. It can be a “good” statistic to have or a “bad” one."For example Jerry West has NEVER shot a 3 pointer. Why? 3 point line was not in the game at
Subjects:
Grades:
6th - 12th
Probability review presentation - AC Year 9 Maths - Statistics and Probability
This product is compliant with Australian Curriculum version 8.4 and version 9.DescriptionThis presentation helps students review essential probability learning from previous years' maths classes. This is suitable for the teaching and learning of Australian Curriculum Year 9 Mathematics (Statistics and Probability) (v8.4/v9).Buying this presentation will save you around 3 hours of time creating it.SequencingBefore this task: students must interconvert between fractions, decimals and percentages,
Subjects:
Grades:
8th - 10th
Compound probability presentation (editable) - AC Year 9 Maths - Probability
This product is compliant with Australian Curriculum version 8.4 and version 9.DescriptionThis presentation helps students explore and understand the formalisms in compound probability concepts, including the application of Boolean logic and various types of diagrams to explain compound probability experiment sample spaces. This is suitable for the teaching and learning of Australian Curriculum Year 9 Mathematics (Statistics and Probability) (v8.4/v9).Buying this presentation will save you aroun
Subjects:
Grades:
8th - 10th
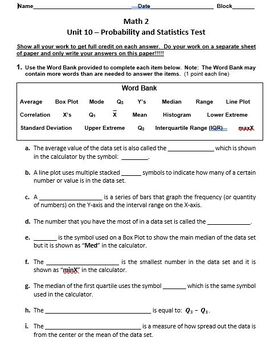
Math 2 Assessment / Practice Test - Unit 10 Probability and Statistics
This MS Word file is a Math 2 Assessment / Practice Test for:Unit 10 - Probability and StatisticsIt consists of eleven (11) separate regular test questions and one (1) extra credit question. I used to use this document as my assessment for Unit 10 for my Math 2 classes. Since I now use an online program for all of my math assessments, I now use this document as a practice test the day before I give any related online assessment. It is twenty one (21) pages in length, including the Teacher Ans
Subjects:
Grades:
9th - 11th
CCSS:
Also included in: Math 2 Assessment/Practice Tests Units 1-10 Bundle
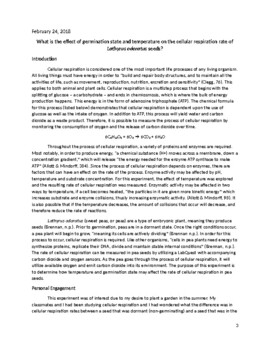
Internal Assessment Example: IB Biology SL/HL (Cellular Respiration)
This is an example Internal Assessment that can be used in the classroom to have students utilize the IA rubric for grading. Having students justify their rubric choices with samples from the text will assist students in understanding the requirements of the IA.
Subjects:
Grades:
11th - 12th, Higher Education, Adult Education
Showing 1-24 of 38 results


