47 results
High school statistics study guide microsofts
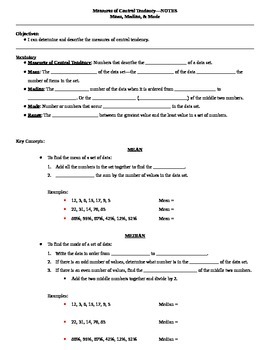
Measures of Central Tendency Guided Notes
These are guided notes for a lesson on measures of central tendency including mean, median, mode, and range. There are several examples in the notes and the same data sets are used to show each measure of central tendency.I have also included a teacher key to show you what to fill in the blanks as your students follow along.To use these notes, I simply projected them onto my whiteboard, gave the students their blank copies, and had them follow along and write what I wrote. This works great when
Subjects:
Grades:
5th - 12th
CCSS:
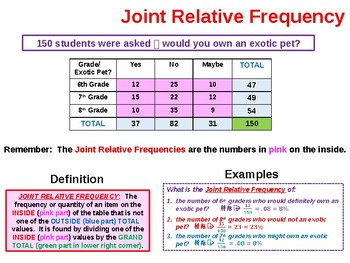
Two Way Frequency Tables Summary
This MS PowerPoint presentation provides background information on 2-Way Frequency Tables as well as the specific steps to follow create and analyze them. It is used to kickoff our study of this subject n my Pre-Algebra and Math I classes. It addresses all of the terms encountered in the construction and use of 2-Way tables including Joint Relative Frequency, Marginal Relative Frequency and Conditional Relative Frequency. It is a totally animated ppt file and very easy for students to underst
Subjects:
Grades:
8th - 10th
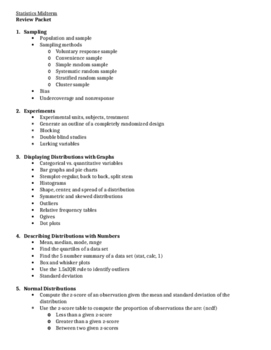
Statistics Midterm Review
This is a 50 question review for a regular level statistics midterm (not AP). Topics include:
Sampling and Experiments
Displaying Distributions with Graphs
Describing Distributions with Numbers
Normal Distributions
Scatterplots and Correlation
Linear Regression and Residuals
Subjects:
Grades:
10th - 12th
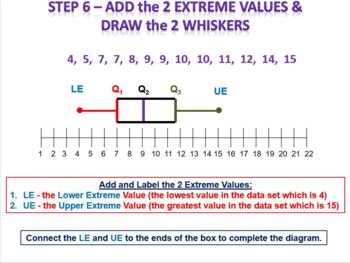
Math 1 / Algebra 1 Bundle - Unit 9 Statistical Measures and Data Analysis
This bundle includes various instructional MS PowerPoint (PPT) slidepacks that I initially use when covering the Math 1/Algebra 1 content area titled: Unit 9 - Statistical Measures and Data Analysis. The following slidepacks are included in this bundle:Box and Whisker Plot Analysis and Construction including Outliers General Statistics - Mean, Median, Mode, Range and Mean Absolute Deviation Mean, Median, Mode, Range and Standard Deviation SummaryScatterplots and Correlation SummaryTwo Way Frequ
Subjects:
Grades:
9th - 12th
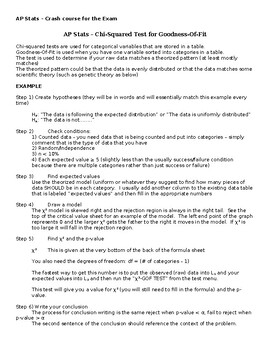
AP Statistics Crash Course - Chi-Squared Tests
The product is meant as a review and summary of chi-squared tests (GOF, homogeneity, and independence) to use prior to the AP Exam. This product contains a summary of the process, two worked-out examples, and two unsolved examples for students to practice.
Subjects:
Grades:
10th - 12th
Types:
CCSS:
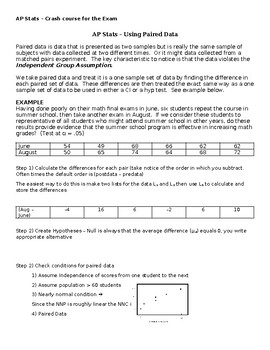
AP Statistics Crash Course - Paired Data Sets
The product is meant as a review and summary of statistical inference with paired data sets to use prior to the AP Exam. This product contains a summary of the process, a worked-out example, and an unsolved example for students to practice.
Subjects:
Grades:
10th - 12th
Types:
CCSS:
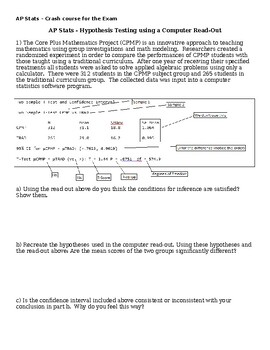
AP Statistics Crash Course - Reading a Computer Print Out
The product is meant as a review and summary of reading a computer print-out for statistical inference to use prior to the AP Exam. This product contains a summary of the process, a worked-out example, and an unsolved example for students to practice.
Subjects:
Grades:
10th - 12th
Types:
CCSS:
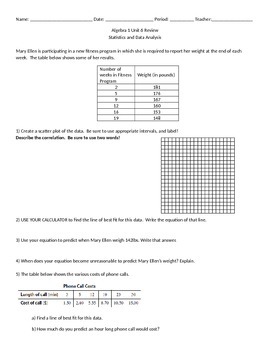
Data Analysis and Statistics Unit Review
Used as a review worksheet (in class or study guide, your choice) covers line of best fit, two way tables, mean, median, mode, 5 number summary, box and whisker, dot plots, frequency table, and histograms. Word doc for your own edits.
Subjects:
Grades:
8th - 10th
Types:
Guided Notes - Scatter Plots and Correlation (Student & Teacher Versions)
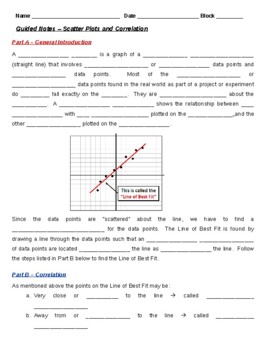
This MS Word file is a Guided Notes document that reviews both the concept and steps involved in solving and developing Scatter Plots for linear equations or functions. It also includes a review of Correlation and how to calculated it using a graphing calculator. I use these notes with my Math 1, Math 2 and Algebra 1 students immediately after I introduce this concept with my PPT presentation slidepack on the same subject. It is 3 full pages of notes for the students to complete and includes t
Subjects:
Grades:
8th - 11th
CCSS:
Scatterplots and Correlation Summary
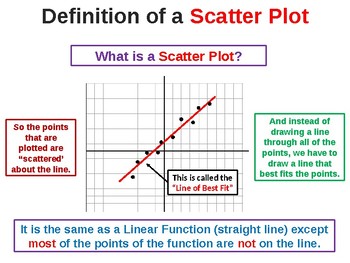
This MS PowerPoint presentation covers the specifics of both Scatterplots and Correlation. It is used to kickoff our study of these topics in my Pre-Algebra and Math I classes. It covers the detailed steps to follow to analyze a data set and construct a Scatterplot and Line of Best Fit as well as determine the Correlation of the data. It covers the steps to use with to determine these measures without a graphing calculator. It is a totally animated ppt file and very easy for students to unde
Subjects:
Grades:
8th - 10th
CCSS:
One Sample Proportion Confidence Interval Quiz (version A)
This assessment asks students to demonstrate an understanding of one sample confidence intervals for proportions. Students are asked to check conditions for, construct, and interpret confidence intervals for one sample proportion. Students are also asked to compute the minimum sample size for a defined margin of error.
Subjects:
Grades:
10th - 12th
CCSS:
Display Describe & Summarize Data Full 15 Question Multiple Choice Quiz
Display Describe & Summarize Data Full 15 Question Multiple Choice QuizStatistical Questions, Mean, Median, Mode, Range, Dot Plots, Frequency Tables, Box Plots, Histograms, M.A.D., IQR, Measures of Center & Variation, Vocabulary including - Symmetrical, Cluster, Outlier, Skewed & Degrees of a circle
Subjects:
Grades:
5th - 9th
Types:
Permutations and Combinations Notes and Examples
This worksheet includes notes and example problems related to permutations and combinations. Permutations and combinations are very similar, so with the help of some pictures, examples, formulas, and example problems, students should know the difference once they are done with this sheet. The worksheet includes a playing card activity, one of my favorite items to use in a statistics classroom.
Subjects:
Grades:
9th - 12th
Types:
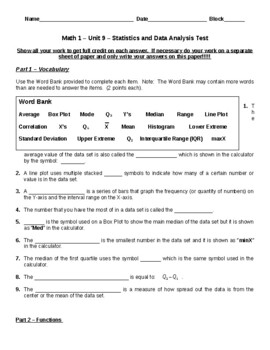
Math 1/Algebra 1 Assessment/Practice Test - Unit 9 Statistics and Data Analysis
This MS Word file is a Math 1/Algebra 1 Assessment / Practice Test for:Unit 9 - Statistics and Data Analysis It consists of seventeen (17) questions and one (1) extra credit item. I used to use this document as my assessment for Unit 9 of my 8th Grade, Math 1 and Algebra 1 classes. Since I now use an online program for all of my math assessments, I now use this document as a practice test the day before I give the online assessment. It is fourteen (12) pages in length, including the Teacher A
Subjects:
Grades:
7th - 10th
Types:
Also included in: Math 1/Algebra 1 Assessment/Practice Tests - Units 1-10 Bundle
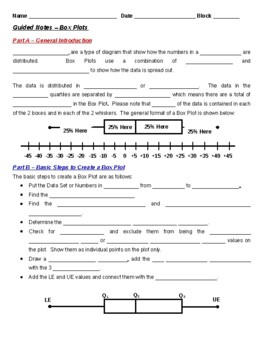
Guided Notes - Box Plots (Student & Teacher Versions)
This MS Word file is a Guided Notes document that reviews both the concept and steps involved in solving and producing Box Plots. I use these notes with my Math 1, Math 2 and Algebra 1 students immediately after I introduce this concept with my PPT presentation slidepack on the same subject. It is 2 full pages of notes for the students to complete and includes the detailed steps that I teach my students to use to solve and produce Box Plots. The 3rd page includes an example problem that is wo
Subjects:
Grades:
8th - 10th
CCSS:

Analyzing and Interpreting Quantitative Data Assessment
This product contains a set of 26 multiple-choice questions focused on quantitative data analysis. It is designed for educators, researchers, and students who want to test their knowledge or prepare for exams in this field.Each question is structured to test the reader's understanding of a specific aspect of quantitative data analysis. The questions cover a range of topics, including statistical software selection, data cleaning, missing data, hypothesis testing, and effect size.The questions ar
Subjects:
Grades:
11th - 12th, Higher Education, Adult Education
Types:
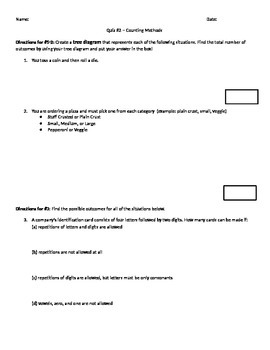
Tree Diagrams, Combinations, Permutations, Counting Principle - Quiz
13 question quiz on the following topics:
- Tree Diagrams
- Fundamental Counting Principle
- Combinations
- Permutations
Students will have to read a word problem and decide which method is best and then use that method to determine the total outcomes.
Subjects:
Grades:
9th - 11th
Types:
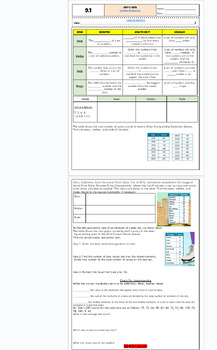
Central Tendencies: Mean, Median and Mode fillable notes: Updated
Unit 9: Data and Stats Updated9.1 Central Tendencies: mean median and modeStudents go over the vocabulary and how to find each average with examples. Notes are scaffolded. Includes hook video hyperlinked on the "learning objective" title. Key is included and hyperlinked as a PDF in the heading highlighted in the orange box, and at the bottom of the google doc as well. Google doc is editable, used in M1 HS
Subjects:
Grades:
6th - 12th, Higher Education, Adult Education
CCSS:
Also included in: Unit 9: Data and Statistics Fillable Notes
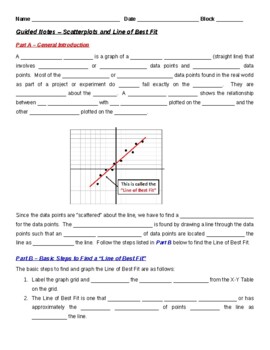
Guided Notes - Scatterplots and Line of Best Fit (Teacher & Student Versions)
This MS Word file is a Guided Notes document that reviews both the concept and steps involved in solving and developing Scatter Plots and Lines of Best Fit for linear equations or functions. I use these notes with my Math 1, Math 2 and Algebra 1 students immediately after I introduce this concept with my PPT presentation slidepack on the same subject. It is 3 full pages of notes for the students to complete and includes the detailed steps that I teach my students to use to develop and graph a
Subjects:
Grades:
8th - 10th
CCSS:
Continuous Probability Distributions Revision Booklet - HSC Mathematics Advanced
A complete and extensive topic workbook on the Mathematics Advance HSC Continuous Probability Distributions topic.Content IncludesCumulative relative frequencies Continuous probability distributions Definitions and PropertiesFurther examples on PDFs and CDFs Mean and Variance of a distribution The Standard Normal Distribution – (Z-distribution) The General Normal Distribution – (X- distribution) Applications of the normal distribution Investigations using the normal distribution Find more great
Subjects:
Grades:
11th - 12th, Staff
Types:
Also included in: HSC Mathematics Advanced Topic Revision Booklets
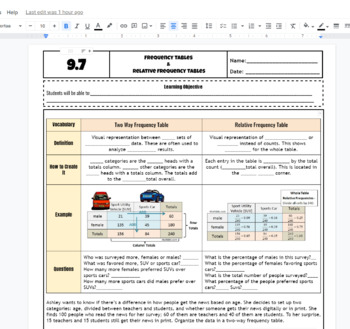
Two way frequency tables and relative frequency table scaffolded fillable notes
Two way frequency tables and relative frequency table scaffolded fillable notes with KEY included for Math 1 HS class. This can be used as a graphic organizer. 100 percent editable to your liking! Introduce the vocabulary with simple problems to finish out the tables and find the percentages of each category. This is an easy introduction lesson students can use for their understanding of frequency tables. You can add in conditional and marginal tables for deeper dive into the concept. Real-worl
Subjects:
Grades:
7th - 12th, Higher Education, Adult Education
CCSS:
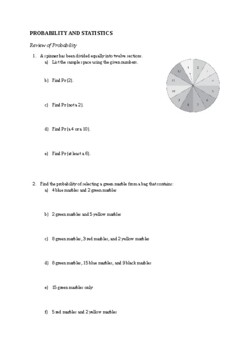
Australian Curriculum - Year 9 Probability and Statistics Revision
14-page revision worksheet which covers:finding probabilitiesVenn diagramstwo-way tablesstem-and-leaf plotstree-diagramsset notationsummary statistics (mean, median, range, etc.)experimental probability
Subjects:
Grades:
8th - 11th
Types:

TEST: Quantitative Data Collection - Sampling, Instruments, and Analysis
This test is designed to evaluate your understanding of key concepts related to quantitative data collection. It consists of 17 multiple-choice questions that cover a range of topics, including sampling procedures, instrument selection, and data analysis.The test begins by assessing your knowledge of unit of analysis, permissions required before beginning a study, and different types of populations and sampling procedures. It then moves on to explore the best sampling procedures to use in differ
Subjects:
Grades:
11th - 12th, Higher Education
Types:
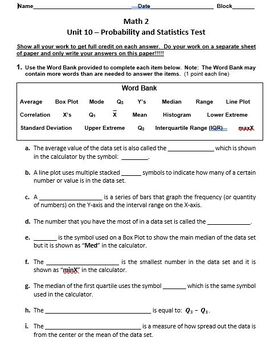
Math 2 Assessment / Practice Test - Unit 10 Probability and Statistics
This MS Word file is a Math 2 Assessment / Practice Test for:Unit 10 - Probability and StatisticsIt consists of eleven (11) separate regular test questions and one (1) extra credit question. I used to use this document as my assessment for Unit 10 for my Math 2 classes. Since I now use an online program for all of my math assessments, I now use this document as a practice test the day before I give any related online assessment. It is twenty one (21) pages in length, including the Teacher Ans
Subjects:
Grades:
9th - 11th
CCSS:
Also included in: Math 2 Assessment/Practice Tests Units 1-10 Bundle
Showing 1-24 of 47 results


