10 results
3rd grade statistics rubrics
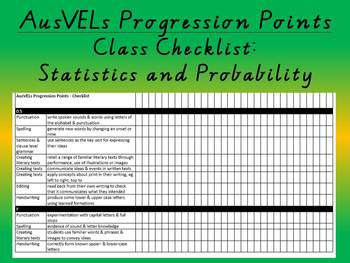
Statistics and Probability - AusVELs Progression Points - Class Checklist
AusVELs progression points for Statistics and Probability presented in a class checklist for primary levels. Great assessment tracker tool.
Subjects:
Grades:
K - 6th
Types:
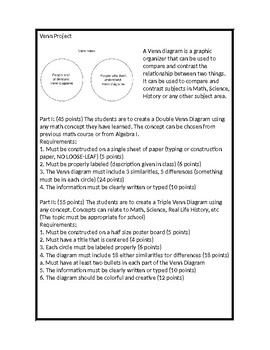
Venn Diagram Project
A Venn diagram is a graphic organizer that can be used to compare and contrast the relationship between two things. It can be used to compare and contrast subjects in Math, Science, History or any other subject area.
Subjects:
Grades:
3rd - 12th
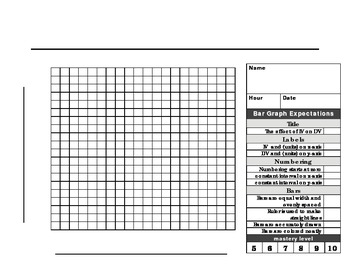
Bar Graph paper and rubric
This 20 X 20 graph paper with rubric is made for a beginner scientist to make a the perfect BAR graph. The checklist format makes it easy for students to know what is expected when graphing. Enjoy!
Subjects:
Grades:
1st - 12th, Higher Education, Adult Education
Types:
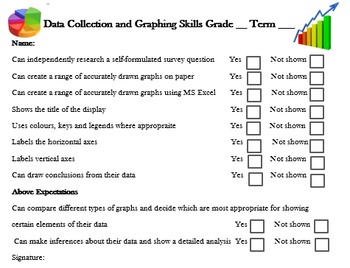
Graph and Data Assessment Checklist & Rubric
Short and quick-to-mark assessment rubric and checklist for graphing tasks suitable for students from grades 2 to 6.
You may also like:
-Comprehensive Multiplication Unit for free
- All Materials Maths units, just click on my store logo to view the full range.
Full set of Maths Assessments:
- Place Value Assessment
- Addition Assessment
- Subtraction Assessment
- Multiplication Assessment
- Division Assessment
- Fractions/Decimals Assessment
Subjects:
Grades:
2nd - 6th
Types:
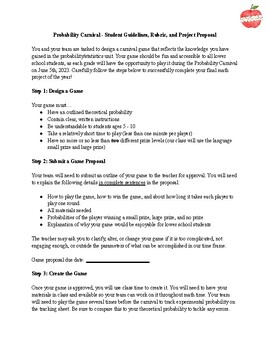
Probability Carnival Freebie
Students will dive into the core skills of probability by designing, creating, proposing, and reflecting upon a carnival game (a bloom's taxonomy dream)! Use and adapt this resource to fit the needs of your classroom to create a memorable learning experience. *Highlights: probability, statistics, graphing, project based learning, game design, teamwork, student-centered learningOptional inquiry-based learning essential question: How can we, as mathematicians, design and create an age appropriate
Subjects:
Grades:
3rd - 8th
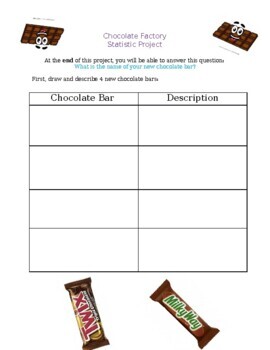
Chocolate Factory Statistics Project with Rubric
Chocolate Factory Statistics and Probability ProjectStudents are to come up with different chocolate bar designs and collect data on which is the most popular.At the end of the project, students can have a go at creating their chocolate bar packaging! Please see the store to see an additional, more comprehensive rubric.
Subjects:
Grades:
1st - 3rd
Types:
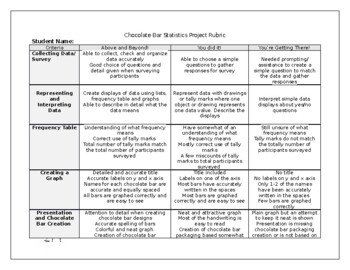
Chocolate Factory Statistics and Probability Project RUBRIC
An additional and more detailed rubric for the Chocolate Factory Statistics and Probability Project
Subjects:
Grades:
1st - 3rd
Types:
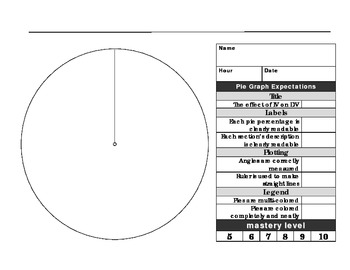
Pie Graph Paper and Rubric
This pie graph paper with rubric is made for a beginner scientist to make a the perfect PIE graph. The checklist format makes it easy for students to know what is expected when graphing. Enjoy!
Subjects:
Grades:
3rd - 12th, Higher Education
Types:
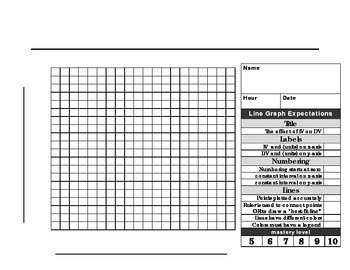
Line graph paper with rubric
This 20 X 20 graph paper with rubric is made for a beginner scientist to make a the perfect LINE graph. The checklist format makes it easy for students to know what is expected when graphing. Enjoy!
Subjects:
Grades:
3rd - 12th, Higher Education
Types:
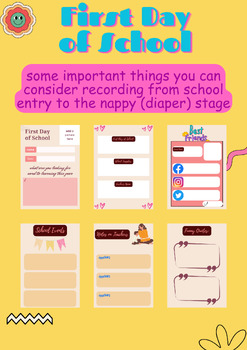
First Day of School
Remember that the key is to document things that feel significant to you and your child. These records will become cherished memories that you can look back on with fondness as your child grows up
Subjects:
Grades:
PreK - 9th
Showing 1-10 of 10 results


