99 results
11th grade Common Core 8.SP.A.1 resources

Oscar Winner -- Data Analysis & Statistics Inquiry - 21st Century Math Project
Utilize the last twenty years of Oscar winners as a data set to guide your students through creating box and whisker plots, histograms, and exploring mean, median, and mode -- in one 21st Century Math Project!Does the age of the award winning star in a film relate to the overall gross of the movie? Student will explore this inquiry question and use the data to support their conclusion.In this 8 page document you will be given a mapping to the Content Standards, an outline for how to implement t
Subjects:
Grades:
6th - 12th
Types:
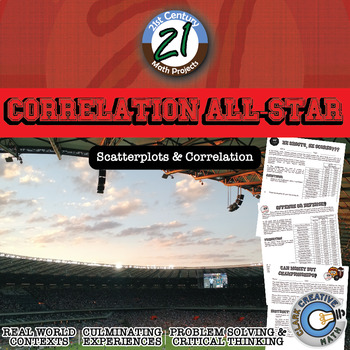
Correlation All-Star -- Sports Data Analysis - 21st Century Math Project
Bring an authentic sports-based math project to your Algebra, Algebra 2 or PreCalculus classroom with Lines of Best Fit and Correlations! All in this 21st Century Math Project! Using data from the MLB, NBA, NFL and NHL students investigate correlations to some of sports most common questions like: "Do more shots result in more goals?" "Do hitters or pitchers have more impact on a team's wins?""What NFL stat is most strongly correlated with wins?" and the grand-daddy..."Can money buy championship
Subjects:
Grades:
7th - 12th
Types:
CCSS:
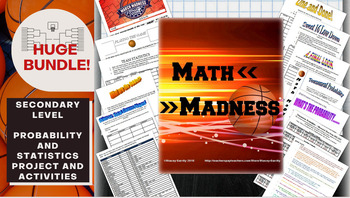
Math March Madness Full Tournament Project {BUNDLE}
Harness the excitement of NCAA March Madness with this huge project for secondary math teachers that follows all stages of the tournament! This Common Core aligned bundle comes with bonus parts not sold individually in my store so you can create a rich immersion in the tournament, practice probability and statistics and learn some interesting new ones along the way! Save $3 plus get bonus content by bundling!You can pick and choose which parts you would like to incorporate, or follow my schedu
Subjects:
Grades:
6th - 12th, Higher Education
Types:
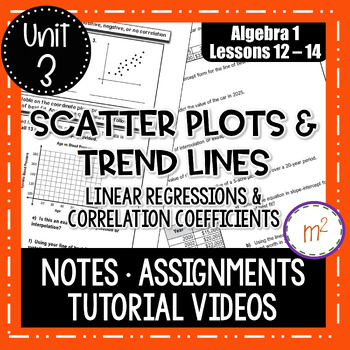
Scatter Plots and Trend Lines (Linear Regressions) - Algebra 1
Algebra 1 Notes and Assignments over Scatter Plots and Trend Lines. TUTORIAL VIDEOS included (no prep to you!) and can be found on my YouTube Channel: mandy’s math world - the videos are on the Linear Functions Unit Playlist! This product includes THREE days of lessons and assignments. Day 1 introduces scatter plots, positive/negative/no correlations, and making predictions by interpolating and extrapolating data. Students will identify general correlations, draw trend lines and make predictio
Subjects:
Grades:
8th - 11th
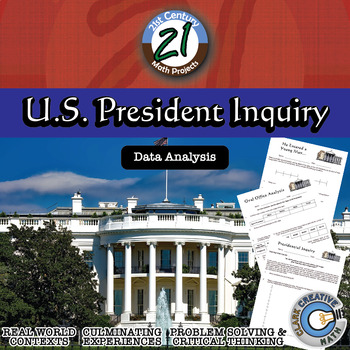
U.S. President -- Data Analysis & Statistics Inquiry - 21st Century Math Project
Engage students in data analysis through use of Presidential data in this 21st Century Math Project. Students will create box and whisker, stem and leaf, histograms and scatterplot through their investigations. In the end, students will take on the inquiry question: "Do US Presidents with the most children live longer after they have been inaugurated?" ***THIS PRODUCT HAS BEEN UPDATED WITH A GOOGLE SLIDES INTERACTIVE VERSION INCLUDED. REDOWNLOAD IF YOU HAVE IT ALREADY***-- In "He Entered a Youn
Subjects:
Grades:
6th - 12th
Types:

42 Blank Graph Templates: Horizontal & Vertical Bar Graph, Line Graph, Printable
Looking for an array of printable graph templates for all your future bar and line graph needs? Look no further! With 42 different templates ranging for bar graphs, to line graphs, varying in X values and Y values, this combination should be the last graph download you need to worry about for your class. These graphs can even be used as Histograms, Dot Plots, Scatter Plots, or a variety of other graphs to suit the needs of your classroom.I created this template to require all the basics of gr
Grades:
4th - 12th
Types:
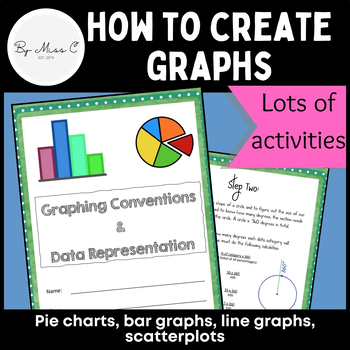
Guide to graphs: Pie charts, bar graphs, line graphs, scatterplots + activities
This is a fantastic resource for introducing students to graphing and data representation. This booklet will take students through the uses for particular graphs and how to construct them. At the end of each module, there are activities for students to complete, to practice their graphing skills. Answer key is included, making this a no-prep activity. This booklet covers: - why we visually represent data- pie charts and how to create them - bar graphs and how to create them - line graphs and how
Subjects:
Grades:
6th - 12th, Higher Education, Adult Education
Types:
CCSS:
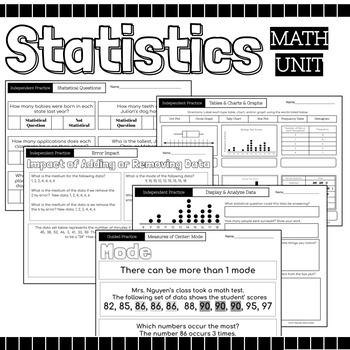
Statistics Math Packet {Data, Charts, Graphs, Mean, Median, Mode, Range, Spread}
52 Page Statics Unit Includes: Guided Instruction & Independent Practice Pages Usage Suggestions and IdeasThis resource can be utilized in numerous ways, here are some ideas:use for guided practiceassign as partner workassign as independent practicecan be used for morning workuse for reteaching in small group settinguse as review prior to assessmentuse as review in continuing to strengthen skillassign for homeworkuse as independent work during math centersTopicsRecognize Statistical Question
Subjects:
Grades:
4th - 12th
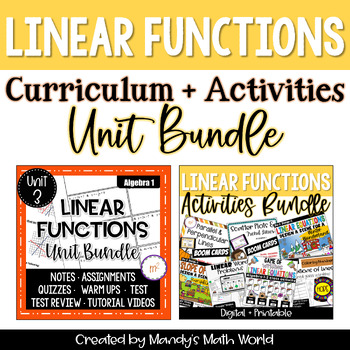
Linear Functions Unit with Activities Bundle Algebra 1 Curriculum
With 20 days of Linear Functions and Equations, this large unit covers all aspects of the most heavily tested Algebra 1 function. Enhance your unit with a variety of activities, including Boom Cards, Google Slides activities and printables! Additionally, spiral previously learned concepts with three spiral review assessments (quick checks)!GENERAL INFORMATION:THE LINEAR FUNCTIONS CURRICULUM UNIT INCLUDES:15 lessons and assignmentsonline tutorial videos 2 quizzes (A & B versions each)16 warmu
Subjects:
Grades:
8th - 11th
Types:
Measures of Center & Variance Unit Bundle - Distance Learning Compatible
This is a selection of my Measures of Center & Variance resources all in a money saving Essential Bundle! You save significant money and time versus purchasing these separately!Essential Bundles are designed to give you everything you need to rock your unit. Warmups, Notes, Activities, Games, Exit Tickets, and Tests. You will find a selection of my Drive Instruction, Escapes, Boot Camp, Adventures, Whodunnits, CSI, Person Puzzles, STEM-ersions, Herowork, TableTop and my 21st Century Math Pro
Subjects:
Grades:
6th - 12th
Types:
Google Forms™ Quiz - Scatter Plots - 8.SP.1-3 - Distance Learning
About This Resource:This is a Google Forms Quiz on scatter plots. The instructions are easy to follow for you to make a copy of the quiz to your Google Drive. Then you can assign to your students using Google Classroom or some other method.Questions on this assessment were carefully created to give our students the best practice on the following standard.8.SP.1 - Construct and interpret scatter plots for bivariate measurement data to investigate patterns of association between two quantities. De
Subjects:
Grades:
8th - 12th
Types:
CCSS:
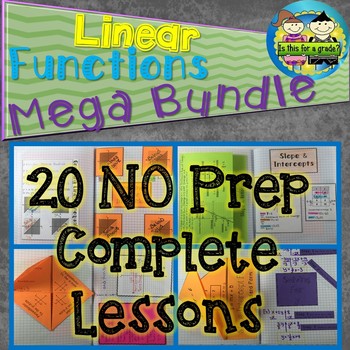
Linear Functions Mega Bundle: No Prep Foldable Lessons
20 Linear Function topics, 21 resources. 20 complete NO PREP foldable lessons. For a completel list of topics click the green preview button below the thumbnails.What's Included in Each Lesson:*Foldable Notes*Interactive Notebook*Practice Worksheet*Exit Ticket*Keys & PicturesSystems of equations task card activity is also included.BONUS day break down of student objective with CCSS and TEKS for easy lesson planning.Your time is precious! Save time using my NO PREP lessons by visiting my stor
Subjects:
Grades:
8th - 11th
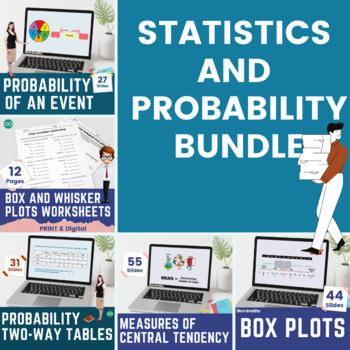
Complete Statistics and Probability Bundle | Digital and Print
This amazing statistics and probability bundle is all you need for your middle school to High school learners. From calculating averages using frequency tables to condition probability, your learners are definitely going to be immersed in their learning! Buy this high-engagement math bundle today and save hours of lesson planning time.Interactive Digital lessons inside this bundle include:Measures of Central tendencyConditional Probability - Venn DiagramsConditional Probability - Two-way tablesP
Subjects:
Grades:
7th - 12th
Types:

Scatter Plot and Bivariate Data Research Project
Students will begin a statistics project on one of their favorite restaurants or food chains! They will be researching nutrition facts and surveying others on what types of food they like to eat there. Through this data collection they will work on their skills of creating scatter plot graphs, creating relative frequency tables, and analyzing this data. This can be used either by paper or digitally. I used it the last two years during distance learning. Rubric included.
Subjects:
Grades:
7th - 12th
Types:
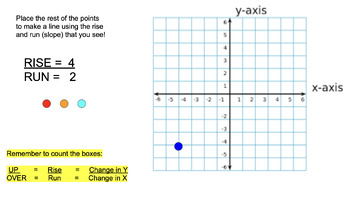
Coordinate Plane, Slope, Rise/Run, Graphing - Online No Prep Bundle
A bundle of activities which can be used as formal lessons or independent practice. Great for Google Classroom or Smart-boards! Also can be used as sub plans! Created by a Special Education Math Teacher to help students become comfortable with graphing!
Grades:
5th - 12th
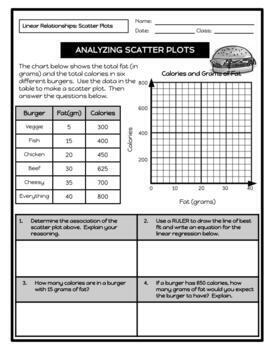
Linear Relationships (Regression): 30+ Scatter Plot Worksheets
Practice using scatter plots with 30+ activities covering the following topics:Quantitative versus Qualitative DataUnivariate Data versus Bivariate DataCausation versus Non-CausationReading a Scatter PlotDetermining Line of Best FitConstructing Scatter PlotsAnalyzing Scatter PlotsDetermining Correlation CoefficientCreating Residual PlotsIndependent InvestigationThese activities can be used as general practice, bell ringers, exit tickets, homework, and/or benchmarks. Students are required to gra
Subjects:
Grades:
8th - 12th
Types:
CCSS:
Graphing Bivariate Data Activity
This activity asks students to construct and interpret scatterplots of bivariate data and find associations between the data.
Data Set 1: Top speed and Longest Drop of Top Roller Coasters
Data Set 2: Mileage and Weight of Popular Vehicles
The 3rd part of the activity asks students to conduct a survey, organize it in a table, graph it, and find the association of:
Number of Siblings and Number of Text Messages Sent Per Month
Graphing Bivariate Data Activity by Suzie's Angle is licensed under
Subjects:
Grades:
8th - 11th
Types:
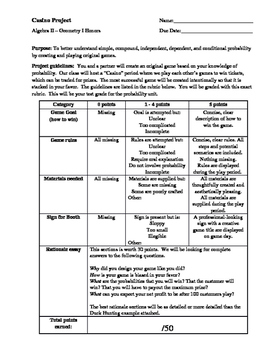
Carnival Probability Project
A project that feels like a game!
Students must create their own game, using probability to ensure THEY are favored to win....much like the house in a casino. Students can make games involving dice, spinners, cards, "fishing" ducks out of a pond, etc.
Assessed skills include: fundamental counting principal, theoretical probability, experimental probability, independent events, dependent events, creativity, writing, presentation. *Students must already know basic probability to complete this
Subjects:
Grades:
8th - 12th
Types:
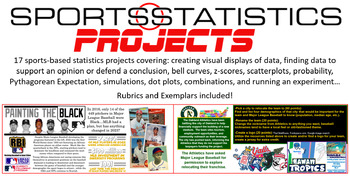
Sports Statistics - Projects ONLY! 17 projects in all
Most of the projects allow students to choose their own topic to display their understanding of statistical topics. Students will:Create a graph of their choosing given dataDesign an infographic on the subject of their choosingResearch and defend their G.O.A.T. choice in a variety of categoriesUse demographics to relocate and rebrand a professional franchiseResearch social injustices in sports and display the dataCreate a bell curve based on career statistics of Michael JordanCompare the salari
Subjects:
Grades:
8th - 12th
CCSS:
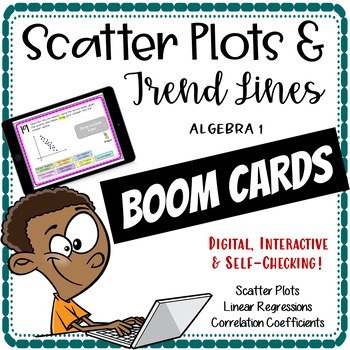
Scatter Plots and Trend Lines BOOM Cards
A digital version of these 26 task cards is accessible through the Boom Learning Platform! Give your students the extra practice WITHOUT the extra prep!Boom Cards offer an interactive, self-checking approach to practice a variety of skills. You can assign these Scatter Plots and Trend Lines Cards to your students OR you can provide them with a Fast Play link (free version option). Card tasks are outlined below:Cards 1 - 6 involve academic vocabulary and require the student to complete the sente
Subjects:
Grades:
8th - 11th
CCSS:
Also included in: Algebra 1 & 2 BOOM CARDS BUNDLE Digital Task Cards
GED Math - Intermediate Problems - 8 Weeks
Your students already know how to work with fractions, decimals, percents, and a calculator. Now get them to the next level. Give them these problem sets to help them pass the GED or HiSET Math tests in 6 to 9 weeks.Use These Problem Sets To:Have students work through up to 9 weeks of problem sets in class, for 3 to 6 hours per week.Teach a variety math topics that are key for college and career readiness, and for passing the GED/HiSET math tests, including: word problems, expressions, equations
Subjects:
Grades:
6th - 12th, Higher Education, Adult Education, Staff
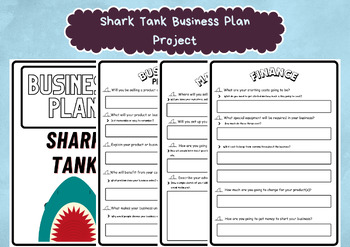
Shark Tank Business Plan Project - Business Strategy Roleplay Game for Kids
Here is what you get:7 pages of Shark Tank Business Plan Project, a fun activity to teach kids about business planning. It can also be a roleplay game where the teacher can be the judge and let students present their projects.All of the products of WorksheetGuardian has been prepared by İrem Kurt, who is the creator of this store.PLEASE NOTE:This is a DIGITAL FILE INSTANT DOWNLOAD only,printable in an array of standard frames sizes.No physical product will be shipped.After checkout you will be d
Grades:
4th - 12th, Higher Education, Adult Education, Staff
Types:
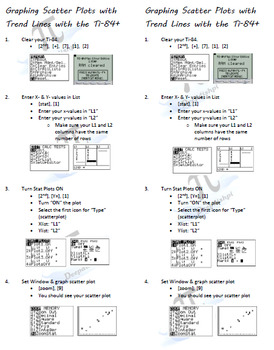
Scatterplots & Linear Regression (Trend Line) on Ti-84 (student notes)
This is a simple step-by-step list for student interactive notebooks.
Steps walk students through entering data, graphing the scatterplot and linear regression (tend line) in the Ti-83/84 family of graphing calculators. Screen shots of what the students see on their Ti are also included to encourage autonomy after initial instruction.
It is ready to be copied as a double-sided page and cut in half (long-wise), saving you precious paper! I hope you find this resource helpful!
TEKS
8.11(A)
Subjects:
Grades:
8th - 12th, Higher Education, Adult Education
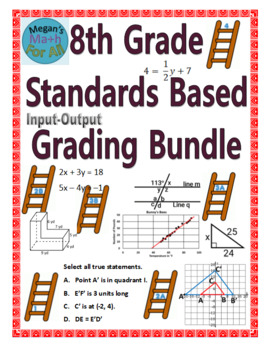
8th Grade Standards Based Grading - Bundle - Editable
Howdy,Update May 2023: Now includes 3 files: an editable Word Doc, a link to editable Google Doc, and a PDF. Do you need a set of assessments for Standards-Based Grading? Or Do you want easy to grade standards based homework assignments? This set of 12 ladders allows you to make the process of standards based grading simple and manageable for you and your students. These ladders are similar to scales but group skills and concepts to cut down on the assessment part of standards-based grading. Th
Subjects:
Grades:
8th - 12th
Types:
Showing 1-24 of 99 results

