20 results
11th grade Common Core 8.SP.A.1 worksheets
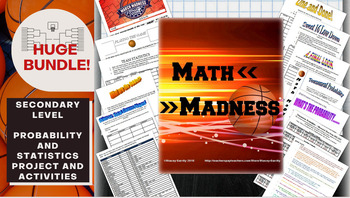
Math March Madness Full Tournament Project {BUNDLE}
Harness the excitement of NCAA March Madness with this huge project for secondary math teachers that follows all stages of the tournament! This Common Core aligned bundle comes with bonus parts not sold individually in my store so you can create a rich immersion in the tournament, practice probability and statistics and learn some interesting new ones along the way! Save $3 plus get bonus content by bundling!You can pick and choose which parts you would like to incorporate, or follow my schedu
Subjects:
Grades:
6th - 12th, Higher Education
Types:

42 Blank Graph Templates: Horizontal & Vertical Bar Graph, Line Graph, Printable
Looking for an array of printable graph templates for all your future bar and line graph needs? Look no further! With 42 different templates ranging for bar graphs, to line graphs, varying in X values and Y values, this combination should be the last graph download you need to worry about for your class. These graphs can even be used as Histograms, Dot Plots, Scatter Plots, or a variety of other graphs to suit the needs of your classroom.I created this template to require all the basics of gr
Grades:
4th - 12th
Types:
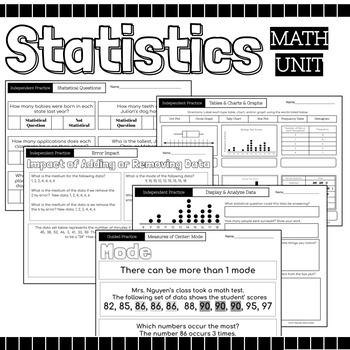
Statistics Math Packet {Data, Charts, Graphs, Mean, Median, Mode, Range, Spread}
52 Page Statics Unit Includes: Guided Instruction & Independent Practice Pages Usage Suggestions and IdeasThis resource can be utilized in numerous ways, here are some ideas:use for guided practiceassign as partner workassign as independent practicecan be used for morning workuse for reteaching in small group settinguse as review prior to assessmentuse as review in continuing to strengthen skillassign for homeworkuse as independent work during math centersTopicsRecognize Statistical Question
Subjects:
Grades:
4th - 12th
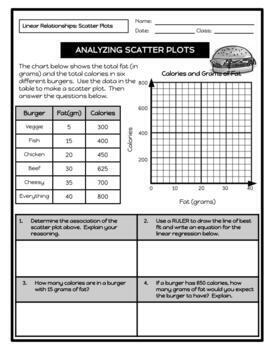
Linear Relationships (Regression): 30+ Scatter Plot Worksheets
Practice using scatter plots with 30+ activities covering the following topics:Quantitative versus Qualitative DataUnivariate Data versus Bivariate DataCausation versus Non-CausationReading a Scatter PlotDetermining Line of Best FitConstructing Scatter PlotsAnalyzing Scatter PlotsDetermining Correlation CoefficientCreating Residual PlotsIndependent InvestigationThese activities can be used as general practice, bell ringers, exit tickets, homework, and/or benchmarks. Students are required to gra
Subjects:
Grades:
8th - 12th
Types:
CCSS:
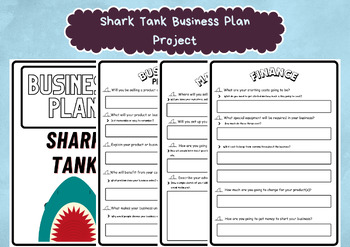
Shark Tank Business Plan Project - Business Strategy Roleplay Game for Kids
Here is what you get:7 pages of Shark Tank Business Plan Project, a fun activity to teach kids about business planning. It can also be a roleplay game where the teacher can be the judge and let students present their projects.All of the products of WorksheetGuardian has been prepared by İrem Kurt, who is the creator of this store.PLEASE NOTE:This is a DIGITAL FILE INSTANT DOWNLOAD only,printable in an array of standard frames sizes.No physical product will be shipped.After checkout you will be d
Grades:
4th - 12th, Higher Education, Adult Education, Staff
Types:
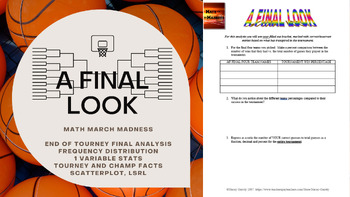
Math March Madness - A Final Look (Freq Distributions, Stats, Regression Lines)
Fill out a bracket, watch the tournament unfold and then mathematically analyze how you did! This activity is flexible enough to be used for a variety of levels. I have used all 6 pages for an AP Statistics class, and have used pages 1 through 5 for an Algebra or Algebra 2 class. You could even use it in lower levels as long as you are covering percents, and basic stats like mean, median, mode and graphing. The document is editable so you can adjust/delete to tailor to the level of statistic
Subjects:
Grades:
4th - 12th, Higher Education
Types:
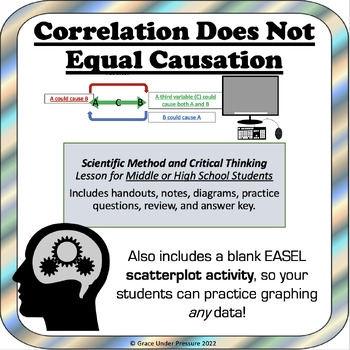
Correlation Does Not Equal Causation: Scientific Method & Critical Thinking
Scientific Method and Critical Thinking Lesson for Middle or High School Students: This printable booklet teaches students about correlation, scatterplots, correlation coefficients, third variables, true experiments, independent and dependent variables, random assignment and more in an easy-to-understand and engaging manner.12 different correlation examples are included. The package includes handouts, notes, diagrams, practice questions, a review, and an answer key.I have also included my blank
Subjects:
Grades:
8th - 12th
Types:
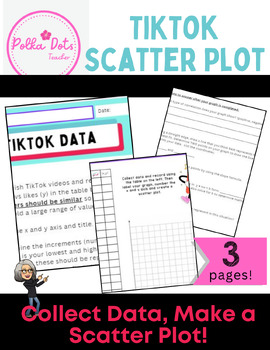
TikTock Scatter Plot and Line of Best fit Data Activity
Students will LOVE collecting data from TikTok! Students keep track of the number of shares and likes each viral video has to create a scatter plot, line of best fit. This activity works best when the videos the choose have similar data points (so viral videos in the millions OR non-viral videos with low numbers). If you do NOT want your students on TIKTOK or their phones, you can easily provide the data for them...but they LOVE collecting on their own!
Subjects:
Grades:
7th - 12th, Higher Education, Adult Education
Types:
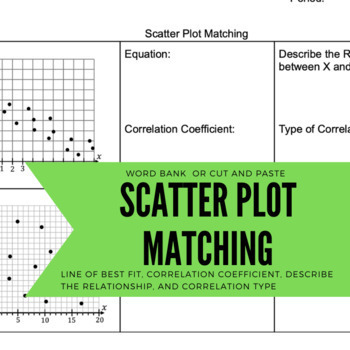
Scatter Plot, Best fit line, and Correlation Coefficient matching activity
Matching or cut and paste activity and worksheet. Students match equations of best fit lines, correlation coefficients, type of correlation, and sentence describing the relationship with 8 scatter plots.
Subjects:
Grades:
7th - 12th
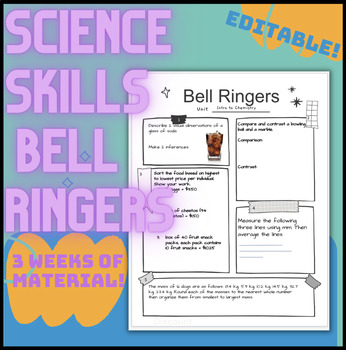
Science Skills Bell Ringers
3 weeks worth of bell ringers focused on basic science skills including determining variables, reading graphs and data tables, making observations and inferences, explaining your thinking, forming hypotheses, sorting information, averaging, measuring, compare and contrast, rounding data and creating a claim. Some questions are open ended and do not have a right/wrong answer, some do have correct answers. These bell ringers are best used with upper middle school through high school. Answer Key is
Subjects:
Grades:
7th - 12th
Types:
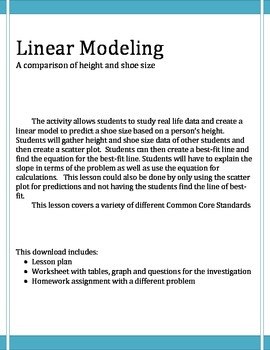
Linear Modeling activity Height vs. Shoe size
This is a great activity to introduce the concept of linear modeling. Students always find this activity fun and interesting.....it involves their data so they tend to take ownership of the investigation. This lesson covers a variety of concepts needed in Algebra. In this investigation students will be required to: plot points on a graph to create a scatterplot, draw a line of best fit, use two points to find the equation, use the equation to make predictions.
Grades:
7th - 12th
Types:
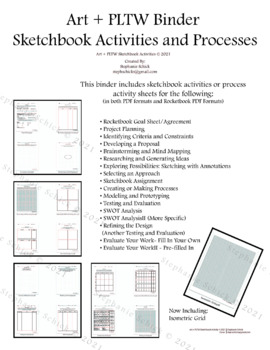
PLTW, Science and Art Processes and Activities Binder
Art + PLTW + Science BinderSketchbook Activities and ProcessesThis binder includes (in both PDF formats and Rocketbook PDF Formats) sketchbook activities or process activity sheets for the following:• Rocketbook Goal Sheet/Agreement• Project Planning• Identifying Criteria and Constraints• Developing a Proposal• Brainstorming and Mind Mapping• Researching and Generating Ideas• Exploring Possibilities: Sketching with Annotations• Selecting an Approach• Sketchbook Assignment• Creating or Making Pro
Grades:
6th - 12th, Higher Education, Adult Education
Types:
NGSS:
MS-ESS3-2
, MS-ETS1-2
, MS-ESS3-1
, HS-ETS1-2
, HS-ETS1-3
...
Correlation of Scatterplots - Printable & Digital Activity Angela Merkel Puzzle
Bring to life the traditional practice class or homework assignment with some global competency and diversity! While your students practice with scatterplots, they can learn about the courageous world leader, Angela Merkel!Person Puzzles are designed to highlight individuals with diverse backgrounds who have made significant contributions to our world. I typically use Person Puzzles as timed warm-ups which allows me to share a little about the person's background before my daily lesson. I can al
Subjects:
Grades:
8th - 12th
Types:
CCSS:

STEM-ersion - Correlations of Scatterplots Printable & Digital Activity
STEM-ersion assignments aim to immerse students in an authentic application within a STEM career. This STEM-ersion focuses on the correlation of scatterplots. Students often ask what careers will use certain math skills and I think this is an opportunity to show them where the thinking is used! These problems aim to help students construct responses with my Evidence - Analysis - Conclusion framework that I use in all of my classes. These questions are carefully crafted not to have one correct an
Subjects:
Grades:
6th - 12th
Types:
CCSS:
Also included in: Measures of Center & Variance Unit Bundle - Distance Learning Compatible
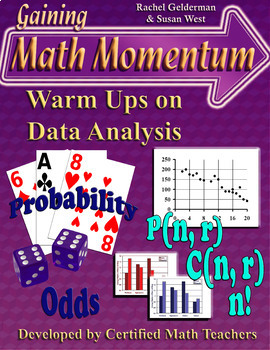
Data Analysis Review Warm-Ups - Probability & Statistics Bell Ringers - Level 2
Review and reinforce concepts in probability & statistics with these multiple choice math warm-ups! Use the detailed easy-to-follow solutions to build proficiency in this critical area! This set contains 45 problems plus 45 solutions written with your students in mind! This set of 15 problem pages (3 problems per page) with detailed solutions was developed by two certified high school math teachers based on standardized testing’s increased emphasis on data analysis. Topics include simple and
Subjects:
Grades:
8th - 11th
Types:
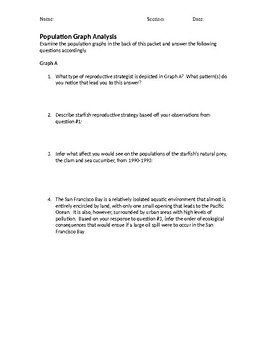
Population Graph Analysis
Students examine graphs showing population fluctuations of two related species in the San Francisco Bay area and answer questions based off of their observations. The activity reviews a plethora of terms and concepts pertaining to Ecology and Biology, such as reproductive strategies, carrying capacity, symbiotic relationships, etc.
Subjects:
Grades:
7th - 12th
Types:
CCSS:

How did the British Army punish soldiers during WW1? Use Historical Evidence
This lesson teaches students about the use of the death penalty by the British Army during the First World War. The students have a clear idea of the conditions in the trenches and that some men deserted. If they were caught they often faced death by firing squad.This lesson uses real data from the National Archive in England to assess why men were sentenced to death (the different crimes committed) and to use this to infer what the army took most seriously and to think about why. They have to
Grades:
8th - 11th
Also included in: World War One History Bundle
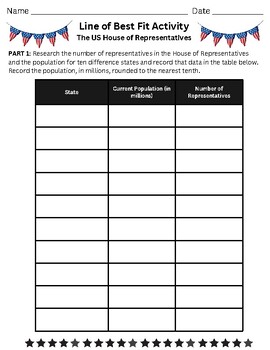
Line of Best Fit - Representation in the House of Representatives
Engage your students in a dynamic exploration of real-world data with our activity focusing on population and representation in the House of Representatives. Students select ten states of their choice to research and analyze, using tables and graphs to organize their findings. With the Desmos Graphing Calculator, they determine the line of best fit for their data set.Following this, students apply their model to solve practical problems, gaining insights into population dynamics and representati
Grades:
8th - 11th
Types:
CCSS:
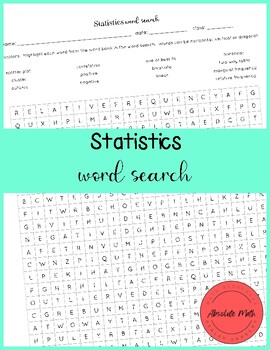
Statistics Word Search
This resource includes:- word search for statistics vocabulary
Subjects:
Grades:
7th - 12th
Types:
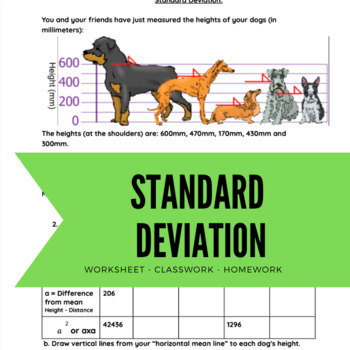
Standard Deviation, Variance, and mean practice worksheet and guided notes.
Standard deviation, variance, and mean worksheet. Perfect for class work or homework. Working with 5 data points for easy computations.
Subjects:
Grades:
6th - 12th
Types:
CCSS:
Showing 1-20 of 20 results

