14 results
11th grade Common Core 8.SP.A.1 resources $5-10

Oscar Winner -- Data Analysis & Statistics Inquiry - 21st Century Math Project
Utilize the last twenty years of Oscar winners as a data set to guide your students through creating box and whisker plots, histograms, and exploring mean, median, and mode -- in one 21st Century Math Project!Does the age of the award winning star in a film relate to the overall gross of the movie? Student will explore this inquiry question and use the data to support their conclusion.In this 8 page document you will be given a mapping to the Content Standards, an outline for how to implement t
Subjects:
Grades:
6th - 12th
Types:
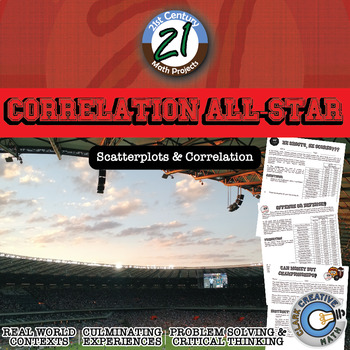
Correlation All-Star -- Sports Data Analysis - 21st Century Math Project
Bring an authentic sports-based math project to your Algebra, Algebra 2 or PreCalculus classroom with Lines of Best Fit and Correlations! All in this 21st Century Math Project! Using data from the MLB, NBA, NFL and NHL students investigate correlations to some of sports most common questions like: "Do more shots result in more goals?" "Do hitters or pitchers have more impact on a team's wins?""What NFL stat is most strongly correlated with wins?" and the grand-daddy..."Can money buy championship
Subjects:
Grades:
7th - 12th
Types:
CCSS:
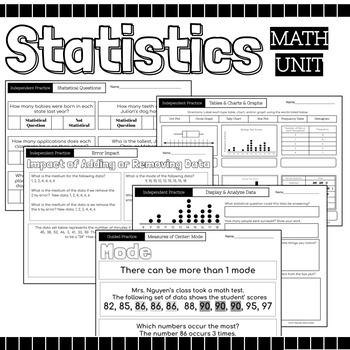
Statistics Math Packet {Data, Charts, Graphs, Mean, Median, Mode, Range, Spread}
52 Page Statics Unit Includes: Guided Instruction & Independent Practice Pages Usage Suggestions and IdeasThis resource can be utilized in numerous ways, here are some ideas:use for guided practiceassign as partner workassign as independent practicecan be used for morning workuse for reteaching in small group settinguse as review prior to assessmentuse as review in continuing to strengthen skillassign for homeworkuse as independent work during math centersTopicsRecognize Statistical Question
Subjects:
Grades:
4th - 12th
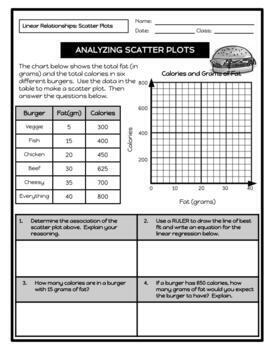
Linear Relationships (Regression): 30+ Scatter Plot Worksheets
Practice using scatter plots with 30+ activities covering the following topics:Quantitative versus Qualitative DataUnivariate Data versus Bivariate DataCausation versus Non-CausationReading a Scatter PlotDetermining Line of Best FitConstructing Scatter PlotsAnalyzing Scatter PlotsDetermining Correlation CoefficientCreating Residual PlotsIndependent InvestigationThese activities can be used as general practice, bell ringers, exit tickets, homework, and/or benchmarks. Students are required to gra
Subjects:
Grades:
8th - 12th
Types:
CCSS:

Scatter Plot and Bivariate Data Research Project
Students will begin a statistics project on one of their favorite restaurants or food chains! They will be researching nutrition facts and surveying others on what types of food they like to eat there. Through this data collection they will work on their skills of creating scatter plot graphs, creating relative frequency tables, and analyzing this data. This can be used either by paper or digitally. I used it the last two years during distance learning. Rubric included.
Subjects:
Grades:
7th - 12th
Types:
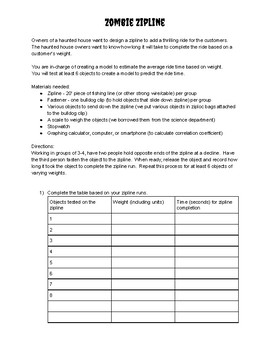
Zombie Zipline - Linear Regression and Line of Best Fit
This fun, hands-on activity presents students with the challenge of designing a zipline for a haunted house. Through the use of data collection and linear regression, students will need to interpret slope, y-intercept, and correlation coefficient (optional). Students work to draw conclusions and make recommendations based on their experiment.
Subjects:
Grades:
8th - 12th
Types:
CCSS:
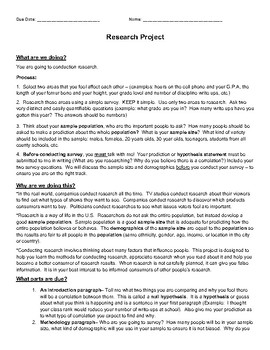
Statistical Research Project and Paper - Let Students Choose the Topic
We know that reading and writing are important skills for any discipline or career. Bring some real-world research experience to your advanced 8th grade classroom or high school math class by teaching them how to apply statistics. Students will have choice in determining the topic of their research project and students may work individually or in small groups to complete the assignment. Through real world application of statistics students will gain valuable experience with writing and readin
Subjects:
Grades:
8th - 11th
Types:
CCSS:
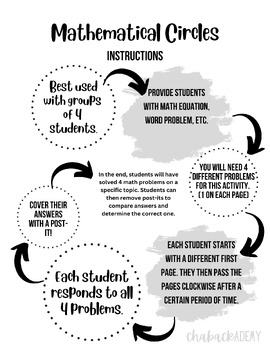
Math Circles Activity - Scatter Plots
Math Circles is a great groupwork activity for your math classroom.1. Create groups of 4 students.2. Create (or use pre-generated) 4 different problems.3. Each student starts with a different first page. They solve the problem, then pass the pages clockwise after an assigned time period. They cover their answer with a post-it.4. Each student responds to all 4 problems.5. By the end of the activity, students have solved 4 problems. They remove the post-its and then can discuss the correct answer
Subjects:
Grades:
6th - 12th
Types:
Also included in: Math Circles Activities Bundle
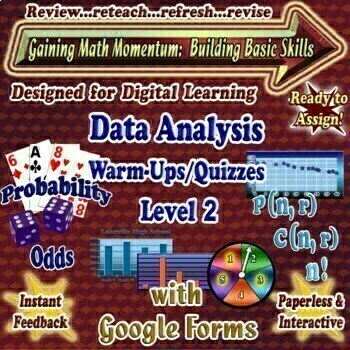
Data Analysis GOOGLE FORMS Math Warm-Ups/Quizzes Bell Ringers Level 2
Emphasize Data Analysis with these multiple choice math warm-ups/quizzes! Use the detailed easy-to-follow solutions to build proficiency in this critical area! This set contains 45 problems plus 45 solutions written with your students in mind! Our multiple-choice math quizzes and/or math warm-ups were developed for teachers and their students by teachers based on their students’ needs and based on standardized testing's increased emphasis on data analysis. These exercises can be used either i
Subjects:
Grades:
8th - 11th
Also included in: Data Analysis GOOGLE FORMS Math Warm-Ups/Quizzes Bell Ringers Bundle
COVID-19 Coronavirus Statistics Project
End of topic or investigative Statistics project which includes data analysis, graphing and predictions. Rubric included.
Subjects:
Grades:
8th - 12th
Types:
CCSS:
Regression - EDITABLE Slides, Notes, INB & Test+++ Drive Math
Drive Instruction with instructional resources that live in the cloud on Google Drive! All of the docs are COMPLETELY EDITABLE and can be differentiated to meet your needs or the needs of your students. PDFs are also included in the download if you prefer them that way. Each Drive Instruction set includes warm-ups, exit tickets, notes, presentations, digital interactive notebooks and tests. These are designed to be complementary to all of my innovative supplemental resources and an improvement o
Subjects:
Grades:
7th - 12th
CCSS:
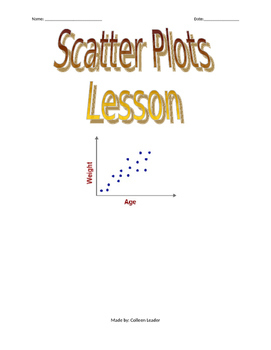
Scatter Plots Lesson
This lesson provides you and the students an explanation of scatter plots and explanations of positive, negative, and no correlation. Then it also includes various controversial scenarios for students to graph data from and analyze. The scenarios are relevant to students and fun to discuss.
Subjects:
Grades:
8th - 11th
Types:
CCSS:
Data Analysis Review Warm-Ups - Probability & Statistics Bell Ringers - Level 2
Review and reinforce concepts in probability & statistics with these multiple choice math warm-ups! Use the detailed easy-to-follow solutions to build proficiency in this critical area! This set contains 45 problems plus 45 solutions written with your students in mind! This set of 15 problem pages (3 problems per page) with detailed solutions was developed by two certified high school math teachers based on standardized testing’s increased emphasis on data analysis. Topics include simple and
Subjects:
Grades:
8th - 11th
Types:
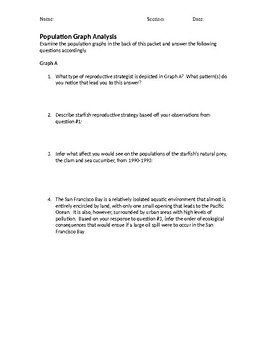
Population Graph Analysis
Students examine graphs showing population fluctuations of two related species in the San Francisco Bay area and answer questions based off of their observations. The activity reviews a plethora of terms and concepts pertaining to Ecology and Biology, such as reproductive strategies, carrying capacity, symbiotic relationships, etc.
Subjects:
Grades:
7th - 12th
Types:
CCSS:
Showing 1-14 of 14 results

