22 results
11th grade Common Core 8.SP.A.1 projects

Oscar Winner -- Data Analysis & Statistics Inquiry - 21st Century Math Project
Utilize the last twenty years of Oscar winners as a data set to guide your students through creating box and whisker plots, histograms, and exploring mean, median, and mode -- in one 21st Century Math Project!Does the age of the award winning star in a film relate to the overall gross of the movie? Student will explore this inquiry question and use the data to support their conclusion.In this 8 page document you will be given a mapping to the Content Standards, an outline for how to implement t
Subjects:
Grades:
6th - 12th
Types:
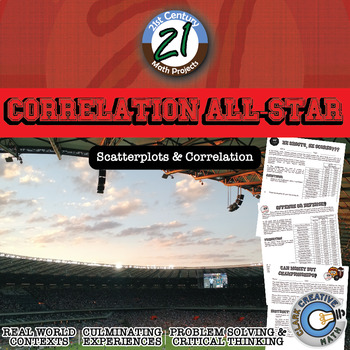
Correlation All-Star -- Sports Data Analysis - 21st Century Math Project
Bring an authentic sports-based math project to your Algebra, Algebra 2 or PreCalculus classroom with Lines of Best Fit and Correlations! All in this 21st Century Math Project! Using data from the MLB, NBA, NFL and NHL students investigate correlations to some of sports most common questions like: "Do more shots result in more goals?" "Do hitters or pitchers have more impact on a team's wins?""What NFL stat is most strongly correlated with wins?" and the grand-daddy..."Can money buy championship
Subjects:
Grades:
7th - 12th
Types:
CCSS:
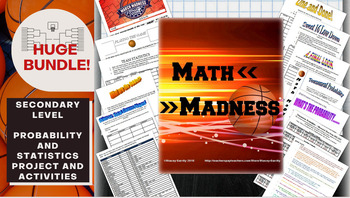
Math March Madness Full Tournament Project {BUNDLE}
Harness the excitement of NCAA March Madness with this huge project for secondary math teachers that follows all stages of the tournament! This Common Core aligned bundle comes with bonus parts not sold individually in my store so you can create a rich immersion in the tournament, practice probability and statistics and learn some interesting new ones along the way! Save $3 plus get bonus content by bundling!You can pick and choose which parts you would like to incorporate, or follow my schedu
Subjects:
Grades:
6th - 12th, Higher Education
Types:
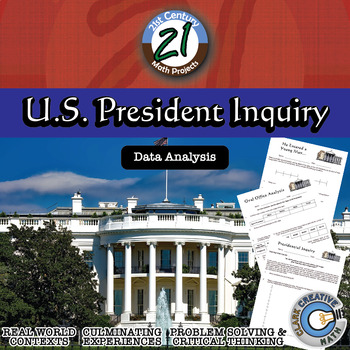
U.S. President -- Data Analysis & Statistics Inquiry - 21st Century Math Project
Engage students in data analysis through use of Presidential data in this 21st Century Math Project. Students will create box and whisker, stem and leaf, histograms and scatterplot through their investigations. In the end, students will take on the inquiry question: "Do US Presidents with the most children live longer after they have been inaugurated?" ***THIS PRODUCT HAS BEEN UPDATED WITH A GOOGLE SLIDES INTERACTIVE VERSION INCLUDED. REDOWNLOAD IF YOU HAVE IT ALREADY***-- In "He Entered a Youn
Subjects:
Grades:
6th - 12th
Types:

Scatter Plot and Bivariate Data Research Project
Students will begin a statistics project on one of their favorite restaurants or food chains! They will be researching nutrition facts and surveying others on what types of food they like to eat there. Through this data collection they will work on their skills of creating scatter plot graphs, creating relative frequency tables, and analyzing this data. This can be used either by paper or digitally. I used it the last two years during distance learning. Rubric included.
Subjects:
Grades:
7th - 12th
Types:
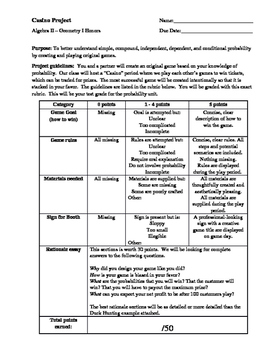
Carnival Probability Project
A project that feels like a game!
Students must create their own game, using probability to ensure THEY are favored to win....much like the house in a casino. Students can make games involving dice, spinners, cards, "fishing" ducks out of a pond, etc.
Assessed skills include: fundamental counting principal, theoretical probability, experimental probability, independent events, dependent events, creativity, writing, presentation. *Students must already know basic probability to complete this
Subjects:
Grades:
8th - 12th
Types:
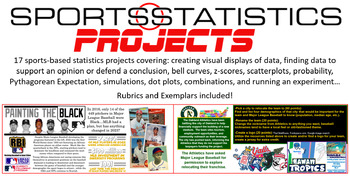
Sports Statistics - Projects ONLY! 17 projects in all
Most of the projects allow students to choose their own topic to display their understanding of statistical topics. Students will:Create a graph of their choosing given dataDesign an infographic on the subject of their choosingResearch and defend their G.O.A.T. choice in a variety of categoriesUse demographics to relocate and rebrand a professional franchiseResearch social injustices in sports and display the dataCreate a bell curve based on career statistics of Michael JordanCompare the salari
Subjects:
Grades:
8th - 12th
CCSS:
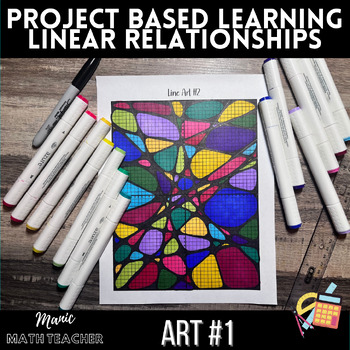
Linear Relationships Art #1 - Graphing Straight Lines - Project Based Learning
Linear Relationships Art #1 - Graphing Straight Lines - PBL, Project Based LearningThis math art project embodies the principles of project-based learning, merging mathematics with artistic expression to engage students in a multifaceted educational experience. Students will graph 18 linear equations, meticulously tracing each line then creating intricate oblong shapes within spaces created by the lines. The project culminates in a vibrant display of color as students fill in each unique shape,
Subjects:
Grades:
7th - 11th
Types:
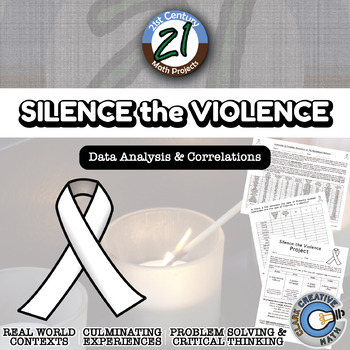
Silence the Violence -- International Data Analysis - 21st Century Math Project
Silence the Violence intends to take a closer look at gun violence throughout the world. Is there a correlation between gun ownership and gun violence? While this is on the news, and people argue back and forth, unfortunately there are not a lot of statistics cited.I built this project through the use of correlations of authentic international data. I have included content for either middle school (plotting and calculating) or high school (calculating correlation with summations). The results ar
Subjects:
Grades:
6th - 12th
Types:
CCSS:
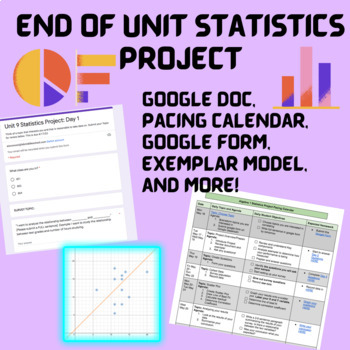
End of Unit Statistics Project- Collecting and Analyzing Data!
This is an amazing hands off project for your students to work on during their statistics unit. I often replace our end of unit test with this project, and make it a take-home assessment so they are doing most of the work for homework, but you could easily build it into your class periods! Students will be required to: come up with a survey topic determine population, sample, and questionsgather the data and turn it into a scatterplotdetermining the line of best fitresidualscorrelation coefficie
Subjects:
Grades:
6th - 12th
Types:
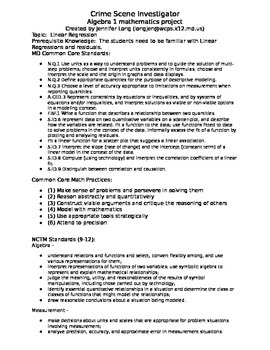
Statistics Investigation for Algebra 1
This project was developed to let the students model mathematics. The students become a detective and determine if a hand, foot, or femur is the best measure of height. This file is the worksheets that go along with the power point. The students need knowledge of linear regression and causation vs. correlation, and residuals. This generally takes at least 2 days in the classroom.
Subjects:
Grades:
8th - 12th
Types:
CCSS:
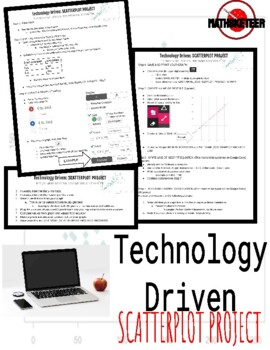
Technology Driven: Scatter Plot Project
This is a TECHNOLOGY DRIVEN project worth 100 points.The following (free) technologies are required:-Google Docs-Kami (Annotating Software)-Desmos (Graphing Software)All Software is available through any Internet Browser.The project features detailed step by step student instructions and examples (with pictures for those not familiar with the software).Project Breakdown:-Research on correlated items (i.e. fat content and calories)-Table Creation-Graphing Points-Line of Best Fit-Conceptual Unders
Subjects:
Grades:
8th - 11th
Types:
CCSS:
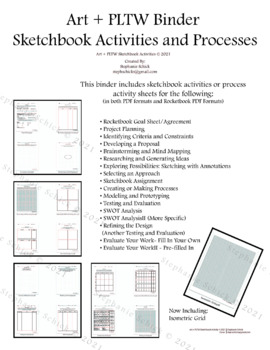
PLTW, Science and Art Processes and Activities Binder
Art + PLTW + Science BinderSketchbook Activities and ProcessesThis binder includes (in both PDF formats and Rocketbook PDF Formats) sketchbook activities or process activity sheets for the following:• Rocketbook Goal Sheet/Agreement• Project Planning• Identifying Criteria and Constraints• Developing a Proposal• Brainstorming and Mind Mapping• Researching and Generating Ideas• Exploring Possibilities: Sketching with Annotations• Selecting an Approach• Sketchbook Assignment• Creating or Making Pro
Grades:
6th - 12th, Higher Education, Adult Education
Types:
NGSS:
MS-ESS3-2
, MS-ETS1-2
, MS-ESS3-1
, HS-ETS1-2
, HS-ETS1-3
...
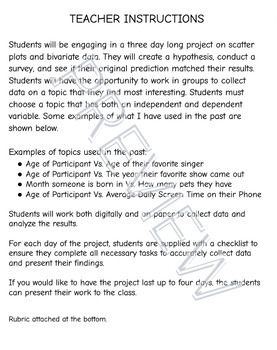
Scatter Plot and Bivariate Data Project
Students will be engaging in a three day long project on scatter plots and bivariate data. They will create a hypothesis, conduct a survey, and see if their original prediction matched their results. Students will have the opportunity to work in groups to collect data on a topic that they find most interesting. Rubric attached at the bottom.
Subjects:
Grades:
6th - 12th
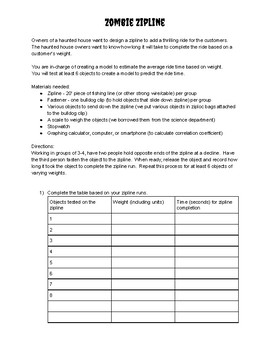
Zombie Zipline - Linear Regression and Line of Best Fit
This fun, hands-on activity presents students with the challenge of designing a zipline for a haunted house. Through the use of data collection and linear regression, students will need to interpret slope, y-intercept, and correlation coefficient (optional). Students work to draw conclusions and make recommendations based on their experiment.
Subjects:
Grades:
8th - 12th
Types:
CCSS:
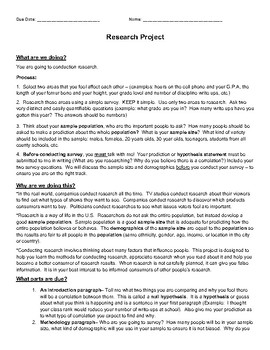
Statistical Research Project and Paper - Let Students Choose the Topic
We know that reading and writing are important skills for any discipline or career. Bring some real-world research experience to your advanced 8th grade classroom or high school math class by teaching them how to apply statistics. Students will have choice in determining the topic of their research project and students may work individually or in small groups to complete the assignment. Through real world application of statistics students will gain valuable experience with writing and readin
Subjects:
Grades:
8th - 11th
Types:
CCSS:
Statistics Investigator for Algebra 1 - Power Point
This is the power point presentation that is to help guide the students through a math modeling activity. The students are detectives that determine if a hand, foot, or femur is the best measure of height. It goes along with the handouts that are also listed on my site. The students need knowledge of linear regression, causation vs. correlation, and residuals. This usually takes about 2 days to complete.
Subjects:
Grades:
8th - 12th
CCSS:
COVID-19 Coronavirus Statistics Project
End of topic or investigative Statistics project which includes data analysis, graphing and predictions. Rubric included.
Subjects:
Grades:
8th - 12th
Types:
CCSS:
Scatterplots Statistics Project Group Presentation Experiment
This project requires students to determine a hypothesis, collect data, make a scatterplot, and analyze the scatterplot for an correlations. Then, students will make predictions, determine if their hypothesis was correct, and present their findings to the class. This project can be used as an independent assignment or as a group project. It can be added to Canvas as a Google Assignment. The project comes with an already made rubric.
Subjects:
Grades:
6th - 12th
CCSS:
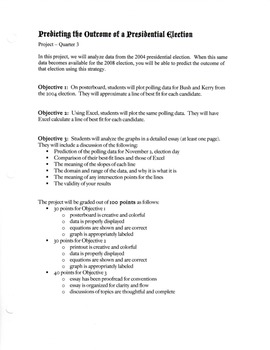
Elections Regression Analysis Unit Project
This project would complement a unit on data analysis or functions and graphing that included regression analysis. In this project, students predict based on polling data who the President of the United States is likely to be in the next election. Data is included for the 2004 election, but it could easily be adapted for any election. Grading requirements included.
Subjects:
Grades:
9th - 11th
Types:
CCSS:
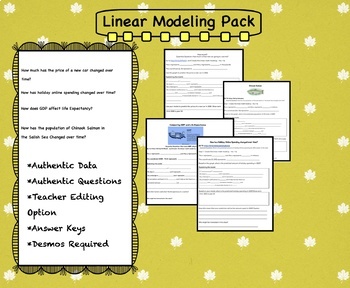
Linear Modeling Pack
4 Different Authentic Scenarios to help students practice linear modeling with Desmos. These 4 scenarios are all structured the same way to help students really understand the model and use the model to make predictions. All of the scenarios are editable by the teacher and come with an answer key. These modeling exercises require the use of Desmos. Each scenario comes with a Desmos graph that uses authentic data.Essential Question: How much is that new car going to cost me? Essential Question: H
Subjects:
Grades:
8th - 11th
Types:
CCSS:
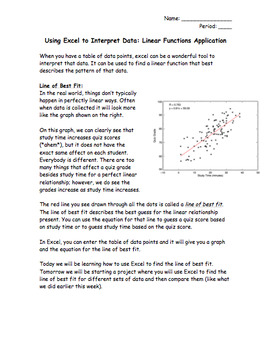
Excel Data Analysis Project
This mini Project covers the concepts of scatterplots and linear regression lines using data analysis in Excel. The project introduces the concepts of scatterplots and lines of best fit, has students work through a basic analysis of a data set using Excel, then has students complete a more complex analysis of a baseball data set. I created this for my standard 8th grade math class to cover CCSSM.8.SP.1, CCSSM.8.SP.3, MP.4, and MP.5 in an engaging and practical way. I had students working in pair
Showing 1-22 of 22 results

