33 results
11th grade algebra Common Core 8.SP.A.1 resources
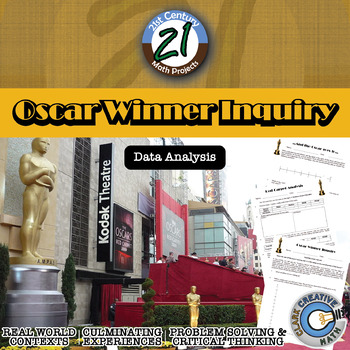
Oscar Winner -- Data Analysis & Statistics Inquiry - 21st Century Math Project
Utilize the last twenty years of Oscar winners as a data set to guide your students through creating box and whisker plots, histograms, and exploring mean, median, and mode -- in one 21st Century Math Project!Does the age of the award winning star in a film relate to the overall gross of the movie? Student will explore this inquiry question and use the data to support their conclusion.In this 8 page document you will be given a mapping to the Content Standards, an outline for how to implement t
Subjects:
Grades:
6th - 12th
Types:
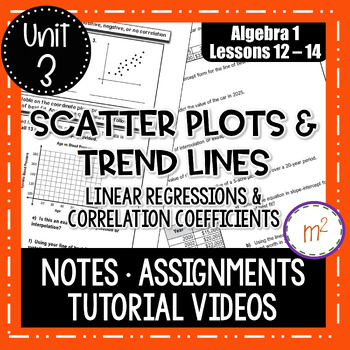
Scatter Plots and Trend Lines (Linear Regressions) - Algebra 1
Algebra 1 Notes and Assignments over Scatter Plots and Trend Lines. TUTORIAL VIDEOS included (no prep to you!) and can be found on my YouTube Channel: mandy’s math world - the videos are on the Linear Functions Unit Playlist! This product includes THREE days of lessons and assignments. Day 1 introduces scatter plots, positive/negative/no correlations, and making predictions by interpolating and extrapolating data. Students will identify general correlations, draw trend lines and make predictio
Subjects:
Grades:
8th - 11th
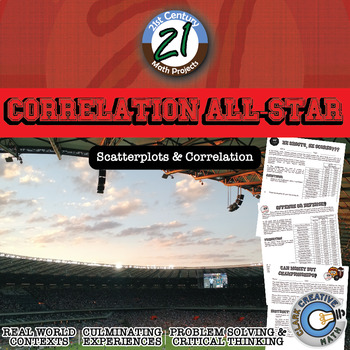
Correlation All-Star -- Sports Data Analysis - 21st Century Math Project
Bring an authentic sports-based math project to your Algebra, Algebra 2 or PreCalculus classroom with Lines of Best Fit and Correlations! All in this 21st Century Math Project! Using data from the MLB, NBA, NFL and NHL students investigate correlations to some of sports most common questions like: "Do more shots result in more goals?" "Do hitters or pitchers have more impact on a team's wins?""What NFL stat is most strongly correlated with wins?" and the grand-daddy..."Can money buy championship
Subjects:
Grades:
7th - 12th
Types:
CCSS:
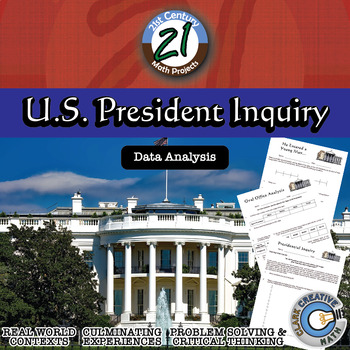
U.S. President -- Data Analysis & Statistics Inquiry - 21st Century Math Project
Engage students in data analysis through use of Presidential data in this 21st Century Math Project. Students will create box and whisker, stem and leaf, histograms and scatterplot through their investigations. In the end, students will take on the inquiry question: "Do US Presidents with the most children live longer after they have been inaugurated?" ***THIS PRODUCT HAS BEEN UPDATED WITH A GOOGLE SLIDES INTERACTIVE VERSION INCLUDED. REDOWNLOAD IF YOU HAVE IT ALREADY***-- In "He Entered a Youn
Subjects:
Grades:
6th - 12th
Types:
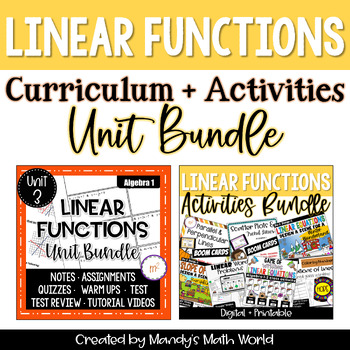
Linear Functions Unit with Activities Bundle Algebra 1 Curriculum
With 20 days of Linear Functions and Equations, this large unit covers all aspects of the most heavily tested Algebra 1 function. Enhance your unit with a variety of activities, including Boom Cards, Google Slides activities and printables! Additionally, spiral previously learned concepts with three spiral review assessments (quick checks)!GENERAL INFORMATION:THE LINEAR FUNCTIONS CURRICULUM UNIT INCLUDES:15 lessons and assignmentsonline tutorial videos 2 quizzes (A & B versions each)16 warmu
Subjects:
Grades:
8th - 11th
Types:
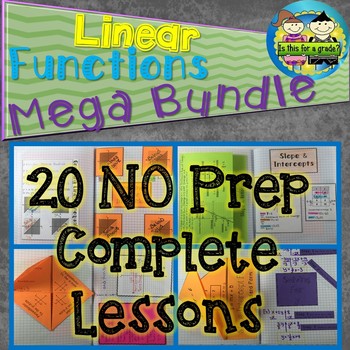
Linear Functions Mega Bundle: No Prep Foldable Lessons
20 Linear Function topics, 21 resources. 20 complete NO PREP foldable lessons. For a completel list of topics click the green preview button below the thumbnails.What's Included in Each Lesson:*Foldable Notes*Interactive Notebook*Practice Worksheet*Exit Ticket*Keys & PicturesSystems of equations task card activity is also included.BONUS day break down of student objective with CCSS and TEKS for easy lesson planning.Your time is precious! Save time using my NO PREP lessons by visiting my stor
Subjects:
Grades:
8th - 11th
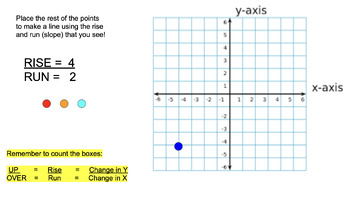
Coordinate Plane, Slope, Rise/Run, Graphing - Online No Prep Bundle
A bundle of activities which can be used as formal lessons or independent practice. Great for Google Classroom or Smart-boards! Also can be used as sub plans! Created by a Special Education Math Teacher to help students become comfortable with graphing!
Grades:
5th - 12th
Graphing Bivariate Data Activity
This activity asks students to construct and interpret scatterplots of bivariate data and find associations between the data.
Data Set 1: Top speed and Longest Drop of Top Roller Coasters
Data Set 2: Mileage and Weight of Popular Vehicles
The 3rd part of the activity asks students to conduct a survey, organize it in a table, graph it, and find the association of:
Number of Siblings and Number of Text Messages Sent Per Month
Graphing Bivariate Data Activity by Suzie's Angle is licensed under
Subjects:
Grades:
8th - 11th
Types:
Scatter Plots and Trend Lines BOOM Cards
A digital version of these 26 task cards is accessible through the Boom Learning Platform! Give your students the extra practice WITHOUT the extra prep!Boom Cards offer an interactive, self-checking approach to practice a variety of skills. You can assign these Scatter Plots and Trend Lines Cards to your students OR you can provide them with a Fast Play link (free version option). Card tasks are outlined below:Cards 1 - 6 involve academic vocabulary and require the student to complete the sente
Subjects:
Grades:
8th - 11th
CCSS:
Also included in: Algebra 1 & 2 BOOM CARDS BUNDLE Digital Task Cards
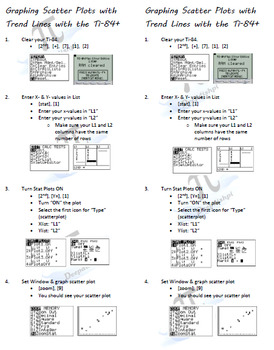
Scatterplots & Linear Regression (Trend Line) on Ti-84 (student notes)
This is a simple step-by-step list for student interactive notebooks.
Steps walk students through entering data, graphing the scatterplot and linear regression (tend line) in the Ti-83/84 family of graphing calculators. Screen shots of what the students see on their Ti are also included to encourage autonomy after initial instruction.
It is ready to be copied as a double-sided page and cut in half (long-wise), saving you precious paper! I hope you find this resource helpful!
TEKS
8.11(A)
Subjects:
Grades:
8th - 12th, Higher Education, Adult Education
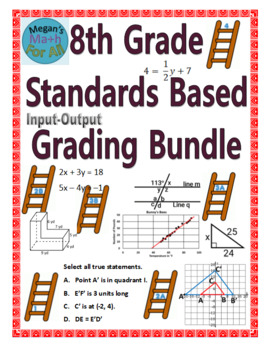
8th Grade Standards Based Grading - Bundle - Editable
Howdy,Update May 2023: Now includes 3 files: an editable Word Doc, a link to editable Google Doc, and a PDF. Do you need a set of assessments for Standards-Based Grading? Or Do you want easy to grade standards based homework assignments? This set of 12 ladders allows you to make the process of standards based grading simple and manageable for you and your students. These ladders are similar to scales but group skills and concepts to cut down on the assessment part of standards-based grading. Th
Subjects:
Grades:
8th - 12th
Types:
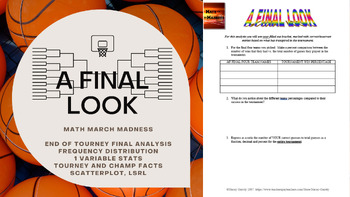
Math March Madness - A Final Look (Freq Distributions, Stats, Regression Lines)
Fill out a bracket, watch the tournament unfold and then mathematically analyze how you did! This activity is flexible enough to be used for a variety of levels. I have used all 6 pages for an AP Statistics class, and have used pages 1 through 5 for an Algebra or Algebra 2 class. You could even use it in lower levels as long as you are covering percents, and basic stats like mean, median, mode and graphing. The document is editable so you can adjust/delete to tailor to the level of statistic
Subjects:
Grades:
4th - 12th, Higher Education
Types:
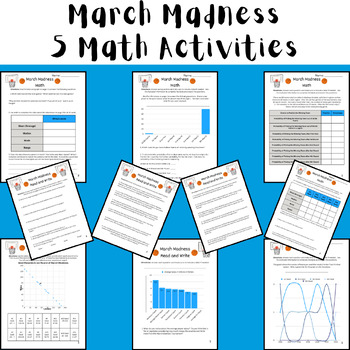
March Madness Men's Math - 5 Activities (Data + Graphs) Printable & Digital 2024
These 5 activities are fun NO PREP math activities to do to celebrate March Madness! The activities can be completed as 5 separate activities, stations, or as a multi-page packet. There is a fully customizable digital resource (Canva Template) and a printable resource (Canva) that contain the same directions and activity for each resource. This was designed for students in middle school, but could be used for upper elementary and high school students in Pre Algebra, Pre-Algebra, or Algebra.In th
Subjects:
Grades:
3rd - 12th
Types:
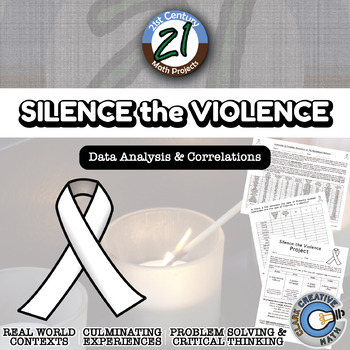
Silence the Violence -- International Data Analysis - 21st Century Math Project
Silence the Violence intends to take a closer look at gun violence throughout the world. Is there a correlation between gun ownership and gun violence? While this is on the news, and people argue back and forth, unfortunately there are not a lot of statistics cited.I built this project through the use of correlations of authentic international data. I have included content for either middle school (plotting and calculating) or high school (calculating correlation with summations). The results ar
Subjects:
Grades:
6th - 12th
Types:
CCSS:
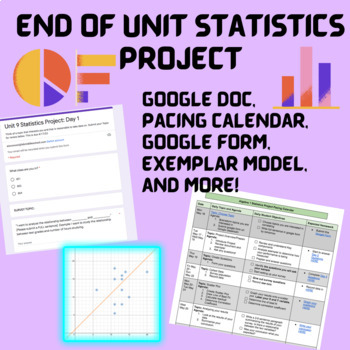
End of Unit Statistics Project- Collecting and Analyzing Data!
This is an amazing hands off project for your students to work on during their statistics unit. I often replace our end of unit test with this project, and make it a take-home assessment so they are doing most of the work for homework, but you could easily build it into your class periods! Students will be required to: come up with a survey topic determine population, sample, and questionsgather the data and turn it into a scatterplotdetermining the line of best fitresidualscorrelation coefficie
Subjects:
Grades:
6th - 12th
Types:
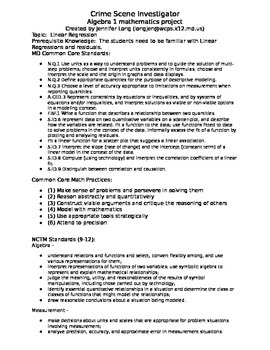
Statistics Investigation for Algebra 1
This project was developed to let the students model mathematics. The students become a detective and determine if a hand, foot, or femur is the best measure of height. This file is the worksheets that go along with the power point. The students need knowledge of linear regression and causation vs. correlation, and residuals. This generally takes at least 2 days in the classroom.
Subjects:
Grades:
8th - 12th
Types:
CCSS:
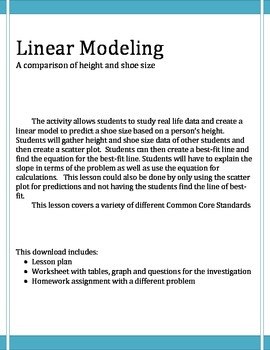
Linear Modeling activity Height vs. Shoe size
This is a great activity to introduce the concept of linear modeling. Students always find this activity fun and interesting.....it involves their data so they tend to take ownership of the investigation. This lesson covers a variety of concepts needed in Algebra. In this investigation students will be required to: plot points on a graph to create a scatterplot, draw a line of best fit, use two points to find the equation, use the equation to make predictions.
Grades:
7th - 12th
Types:
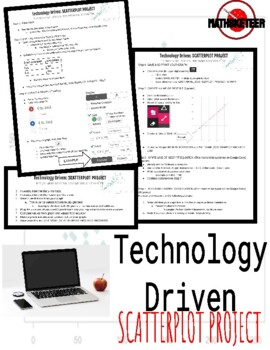
Technology Driven: Scatter Plot Project
This is a TECHNOLOGY DRIVEN project worth 100 points.The following (free) technologies are required:-Google Docs-Kami (Annotating Software)-Desmos (Graphing Software)All Software is available through any Internet Browser.The project features detailed step by step student instructions and examples (with pictures for those not familiar with the software).Project Breakdown:-Research on correlated items (i.e. fat content and calories)-Table Creation-Graphing Points-Line of Best Fit-Conceptual Unders
Subjects:
Grades:
8th - 11th
Types:
CCSS:
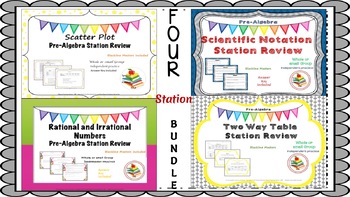
Algebra Station Bundle Irrational Number, Scientific Notation, Statistics
Algebra Station Bundle4 complete stations! All four include Expectations you can post in your classroom, student self-monitoring checklists, and each station/task card contains student friendly directions. Laminate the colors cards and/or copy the black-line masters for student use. Can be used as whole group, small group, partners, and even individual.Can be used even as a task card cooperative learning activity! These stations are a great way to engage your students, as they become more self-
Subjects:
Grades:
8th - 11th
Types:
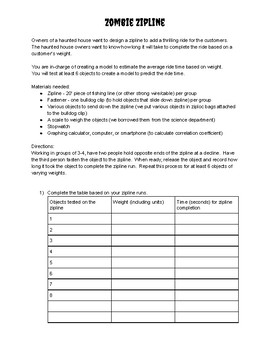
Zombie Zipline - Linear Regression and Line of Best Fit
This fun, hands-on activity presents students with the challenge of designing a zipline for a haunted house. Through the use of data collection and linear regression, students will need to interpret slope, y-intercept, and correlation coefficient (optional). Students work to draw conclusions and make recommendations based on their experiment.
Subjects:
Grades:
8th - 12th
Types:
CCSS:
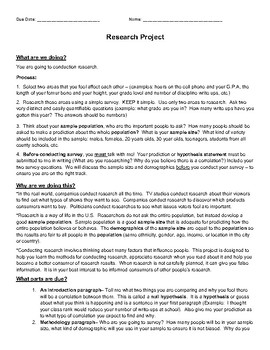
Statistical Research Project and Paper - Let Students Choose the Topic
We know that reading and writing are important skills for any discipline or career. Bring some real-world research experience to your advanced 8th grade classroom or high school math class by teaching them how to apply statistics. Students will have choice in determining the topic of their research project and students may work individually or in small groups to complete the assignment. Through real world application of statistics students will gain valuable experience with writing and readin
Subjects:
Grades:
8th - 11th
Types:
CCSS:
Statistics Investigator for Algebra 1 - Power Point
This is the power point presentation that is to help guide the students through a math modeling activity. The students are detectives that determine if a hand, foot, or femur is the best measure of height. It goes along with the handouts that are also listed on my site. The students need knowledge of linear regression, causation vs. correlation, and residuals. This usually takes about 2 days to complete.
Subjects:
Grades:
8th - 12th
CCSS:
Linear Relationships: Scatter Plots (Linear Regression) - 100+ Slides
These lessons focus on how to read, create and analyze scatter plots. Students use what they already know about linear equations to determine the line of best and use their graphing calculators to determine the correlation coefficient. These lessons includes step-by-step animated lesson notes and practice problems. The slides are fully editable for you and your student's needs. You can pick and choose the slides you need, use other slides for reteaching, duplicate slides and modify them as nee
Grades:
8th - 12th
CCSS:
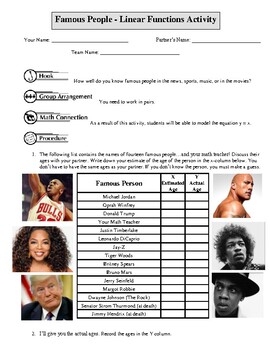
Famous People Ages - Scatterplot Activity
This is a graphic organizer that contains an activity where students work in pairs to guess 14 famous peoples ages...as well as yours! Then with the actual ages they make a scatterplot, utilize and interpret the line y = x, and then examine their own overestimation or underestimation. This is a very engaging activity and students really get into it to correctly guess celebrities ages. Then they react and reflect when they hear the actual ages! Students are further engaged in plotting their own d
Grades:
5th - 12th
Showing 1-24 of 33 results


