8 results
Statistics bulletin board ideas for Microsoft Word
Statistics In My World Project
This is a great project for students to do at the beginning of a HS statistics class. It will open their eyes to statistics in the media and provides real world interpretation of material learned the first couple weeks of class. The best part - You get lots of decorations for your wall and material to use as you progress through descriptive statistics!
Package includes instructions for teacher, including CCSM standards and objectives; student handout outlining specifics of the project; gradi
Subjects:
Grades:
11th - 12th
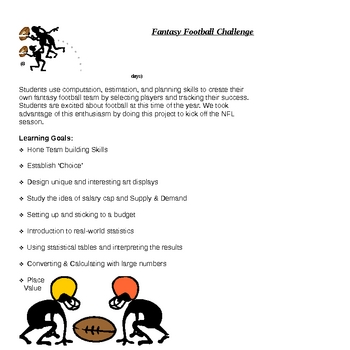
Are You Ready for Some FOOTBALL? (Middle School MATH Project)
Are you looking for a unique way to engage your students in authentic math concepts using real-world data that will blow their socks off? If so, this is your project! I have used this with eighth graders, but it would work well with any middle school performance indicators. This project involves so many performance indicators - estimation, rational numbers, scientific notation, number & word forms, budgeting, graphs, statistics, integers, media, cooperative learning, research, technology, vi
Subjects:
Grades:
5th - 8th
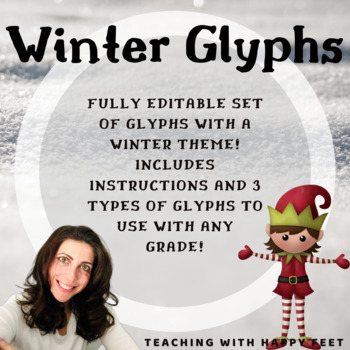
Winter Themed Holiday Glyphs
These themed holiday glyphs include an elf, snowman, and reindeer. Use these glyphs as a single lesson on data collection, or refer back to them again and again. These engaging glyphs address skills like following instructions, collaboration, data collection, and analytical skills. Whether you are a seasoned vet with glyphs or trying them for your first time these FULLY CUSTOMIZABLE glyphs can be altered to fit the needs of any class or grade.
Subjects:
Grades:
Not Grade Specific

Using Statistics in Marketing
A wonderful, common core application of how statistics are manipulated in the real world!
Students will use a data sheet to compare the nutrition facts of various products from a few popular fast food chains. They will be given a product/company to market for, and use data provided to create a claim to do this. They will justify their claim using evidence from the data, and design an advertisement for this product/company.
Subjects:
Grades:
6th - 9th
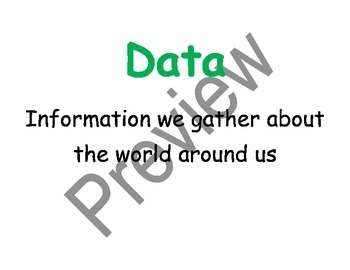
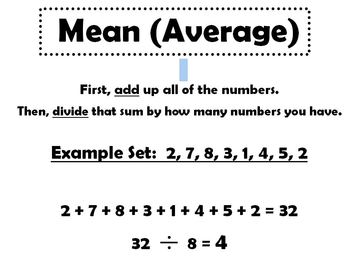
Data Landmark Posters
Teachers can print out these posters when they are teaching mean (average), median, mode, range, maximum, minimum. They show the basic meaning for each word and an example on each poster. They can be printed on 8.5 X 11 size for small group teaching, or be enlarged for posting on the walls. They are helpful reminders for students who have a hard time keeping of track of what each one means.
From Illini Teacher
Subjects:
Grades:
3rd - 5th
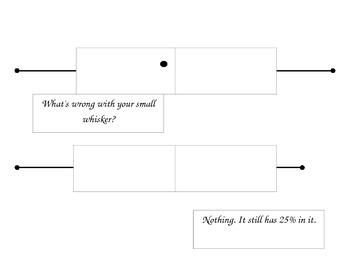
Box and Whisker Cartoon
A cartoon to help students remember about the percentages in a box and whisker plot.
Subjects:
Grades:
6th - 8th
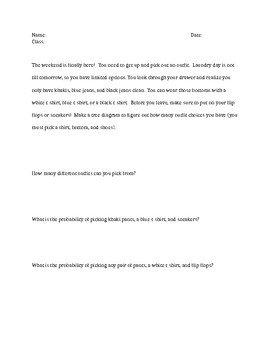
Probability Task
Students must find the probability of different outfit combinations along with creating a tree diagram. Perfect for a bulletin board.
Subjects:
Grades:
5th - 7th
CCSS:
Showing 1-8 of 8 results


