137 results
Statistics bulletin board idea pdfs
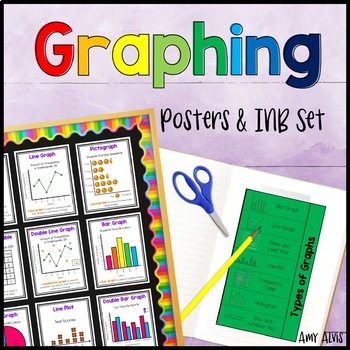
Graphing Posters & Interactive Notebook Bar Graph Picture Graph Line Plot
This poster or anchor chart and interactive notebook (INB) set includes FOURTEEN posters covering bar graphs, double bar graph, pictographs, picture graph, line graphs, double line graph, line plot, circle graphs, frequency tables, sector graph, stem and leaf plots, histograms, dot plots, parts of a graph and box and whisker plots. This set also includes SIX different foldable interactive notebook (INB) pages (that you print and put into a paper notebook) for students to take notes as well as a
Subjects:
Grades:
2nd - 5th
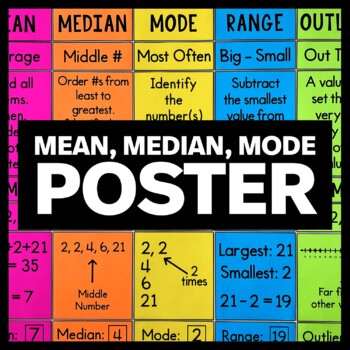
Mean, Median, Mode Poster - Measures of Central Tendency - Math Classroom Décor
Do you need a little help teaching measures of central tendency to your math class? Are you looking for a mean, median, and mode bulletin board display? This poster will look GREAT on your word wall and will help your upper elementary or middle school math class remember this important concept. Two different versions of the poster are included along with several alternate panels for mean, median, mode, and range. Extra panels for "outlier" are not included.The first version of the poster has
Subjects:
Grades:
5th - 8th
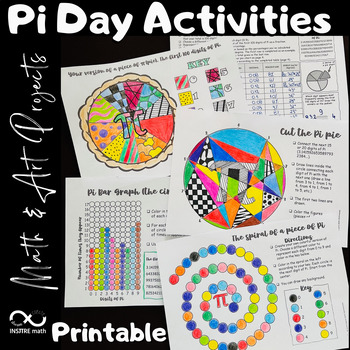
4 Pi Day Math Activities | Math & Art Projects | Coloring Circles | Pie Chart
4 Math & Art Projects to celebrate Pi Day that include circles and Pi exploration! Your students will love these Pi Day activities! Let your students express themselves using these hands-on Math & Art resources during the exploration of Pi.Content:- Your version of a piece of π (pie). The first 100 digits of Pi. Frequency Pie Chart.- Pi Bar Graph - the circular version.- The spiral of a piece of Pi.- Cut the Pi pie.This resource includes:- The editable PowerPoint™ version.- The printable
Subjects:
Grades:
4th - 8th
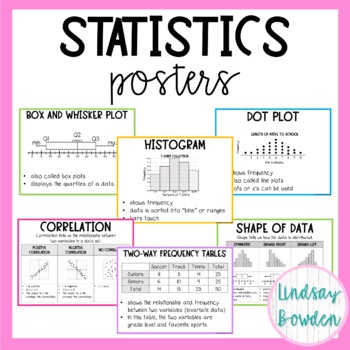
Statistics Posters (Algebra 1 Word Wall)
These statistics posters come with 18 posters on letter paper (8.5" by 11"). They are meant to be printed in color, but you can also print them in black and white.Posters include:box and whisker plots, histograms, stem and leaf, dot, plot, range, interquartile range, measures of central tendency, mean absolute deviation, shape of data, peaks in data, spread of data, scatter plots, correlation, causation vs. correlation, line of best fit, two-way frequency tables, standard deviation, normal dist
Subjects:
Grades:
8th - 10th
Also included in: Statistics Unit Bundle
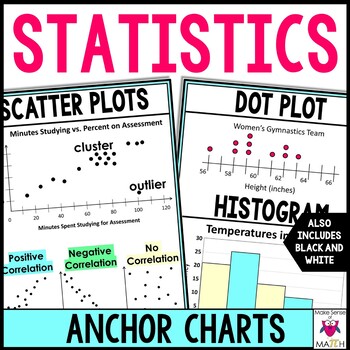
Statistics Anchor Charts Posters | Middle School Math Statistics
These statistics anchor charts or personal reference sheets include visuals for dot plots, histograms, box plots, and scatter plots. They also include measures of center: mean, median, and mode, as well as measures of variation: interquartile range and mean absolute deviation. Colored and black and white copies are included. Colored and black and white copies are included. Check out the preview to see all the anchor charts. Includes: Dot Plot and HistogramBox PlotMeasures of Center: Mean, Medi
Subjects:
Grades:
6th - 8th

How Much is Your Name Worth? Find the Mean, Median Mode of Your Name!
Looking for an engaging way to teach and review mean, median, mode and range? This activity is not only fun and challenging BUT it is PERFECT for bulletin boards.
Included in this set:
-Slides 3-6 are a review or teaching tool to reinforce how to find solve for each: Mean, Median, Mode and Range.
* (Brain Pop has a great video for this!)
-Slide 7 is the key for finding out the value of their first and last name
-Slide 8 is where they figure out and record how much their name is worth
- Sli
Subjects:
Grades:
3rd - 5th
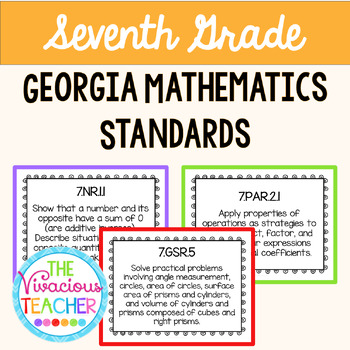
Georgia Mathematics Standards Posters for Seventh Grade
This pdf file includes Georgia Mathematics Standards posters for Seventh Grade. They have been updated for the 2023-2024 school year. These posters were designed in black and white so you can save your color ink! I print these posters on colored card stock and laminate so they are ready to hang in my classroom year after year.Standards included:Mathematical Practices and ModelingNumerical ReasoningPatterning and Algebraic ReasoningGeometric and Spatial Reasoning♥♥♥♥♥♥♥♥♥♥♥♥♥♥♥♥♥♥♥♥♥♥♥♥♥♥♥♥♥♥♥♥♥♥
Subjects:
Grades:
7th
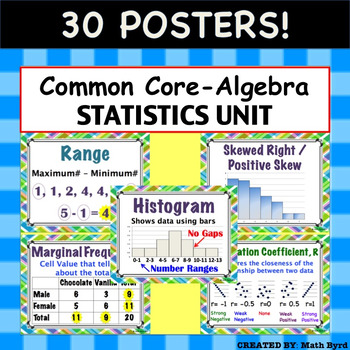
Common Core Algebra - Statistics Unit: Describing Data POSTERS
30 Posters! Each 8.5" x 11" in size. Posters are aligned with Common Core's Algebra - Statistics: Describing Data Unit. Posters Included:MeanMedianModeRangeInterquartile RangeOutlierMean Absolute DeviationMeasures of CenterMeasures of SpreadDot PlotHistogramBox PlotNormal/ Bell Shaped DistributionSkewed Right/Positive SkewSkewed Left/ Negative SkewUniform2 Way Frequency TableJoint FrequencyMarginal Frequency2 Way Relative Frequency TableConditional Relative FrequencyScatter PlotCorrelationCorrel
Subjects:
Grades:
8th - 11th
CCSS:
Also included in: Common Core Algebra 1 POSTERS - BUNDLE PRICE!
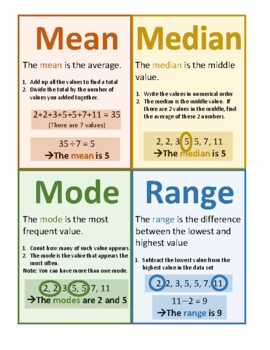
Mean Median Mode Range Poster Notes Anchor Chart
The PDF poster describes mean, median, mode, and range in an easy-to-understand and visual way. Enjoy!Check out my other posters here:STEM: Women in STEM Insp. Quotes, Women in STEM, Careers, Heroes Timeline, Inspirational Quotes from STEM HeroesABCs of Math: STEM Innovations, Amazing STEM facts, Careers, Shapes, in Nature Modern Style, in Nature Vintage Style, in Everyday LifeMath Vocabulary Alphabet: Elementary, Middle School, High SchoolMath in Art: Set A, Set B, Big BundleMath Modelling: Se
Subjects:
Grades:
5th - 9th
Types:
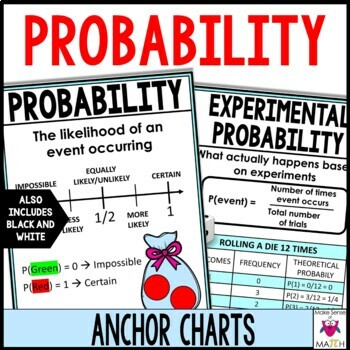
Probability Anchor Charts Posters | Middle School Math Probability
These probability anchor charts or personal reference sheets include visuals for probability, theoretical and experimental probability, tree diagrams, and a quick run down of probability vocabulary. Colored and black and white copies are included. Includes: ProbabilityTheoretical ProbabilityExperimental ProbabilityTree DiagramsProbability VocabularyHow to create your own poster instructionsOther Products you may be Interested in▸ Statistics Anchor Charts▸ Probability Activity - Law of Large Nu
Subjects:
Grades:
6th - 8th
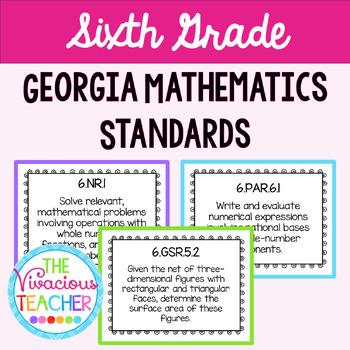
Georgia Mathematics Standards Posters for Sixth Grade
This pdf file includes Georgia Mathematics Standards posters for Sixth Grade. They have been updated for the 2023-2024 school year. These posters were designed in black and white so you can save your color ink! I print these posters on colored card stock and laminate so they are ready to hang in my classroom year after year.Standards included:Mathematical Practices and ModelingNumerical ReasoningPatterning and Algebraic ReasoningGeometric and Spatial Reasoning♥♥♥♥♥♥♥♥♥♥♥♥♥♥♥♥♥♥♥♥♥♥♥♥♥♥♥♥♥♥♥♥♥♥♥♥
Subjects:
Grades:
6th
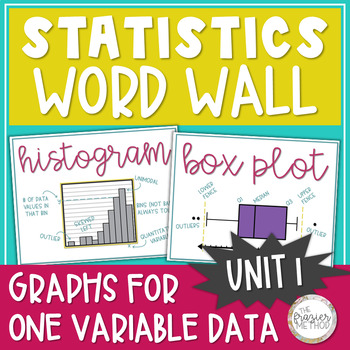
Statistics Word Wall Posters - Histogram, Box Plot, Bar Graph, Dot Plot Unit 1
Use these Statistics Posters to add high school math classroom decor to your bulletin board, hallway, math word wall, or classroom door with these great 8.5" by 11" Statistics Word Wall pages filled with statistics vocabulary, formulas, and graphs! All graphs are from Unit 1: Exploring One-Variable Data in AP Statistics, and the information on each slide aligns with AP College Board's objectives and standards for AP Statistics. ALL PAGES ARE IN COLOR & GRAYSCALE.Size: 8.5 by 11 inches[If you
Subjects:
Grades:
10th - 12th
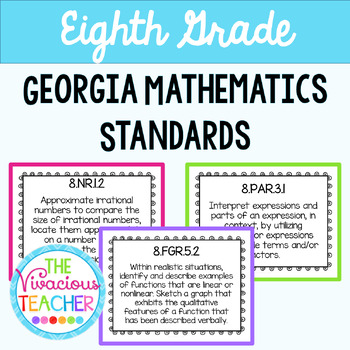
Georgia Mathematics Standards Posters for Eighth Grade
This pdf file includes Georgia Mathematics Standards posters for Eighth Grade. They have been updated for the 2023-2024 school year. These posters were designed in black and white so you can save your color ink! I print these posters on colored card stock and laminate so they are ready to hang in my classroom year after year.Standards included:Mathematical Practices and ModelingNumerical ReasoningPatterning and Algebraic ReasoningFunctional and Graphical ReasoningGeometric and Spatial Reasoning♥
Subjects:
Grades:
8th
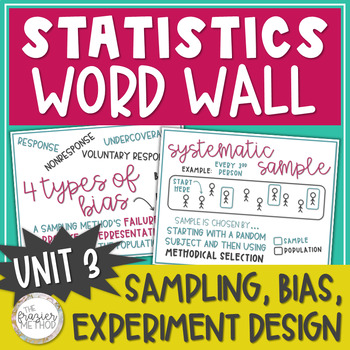
Statistics Word Wall Posters Sampling Methods, Bias, Experiment Design AP Unit 3
Use these Statistics Posters to add high school math classroom decor to your bulletin board, hallway, math word wall, or classroom door with these great 8.5" by 11" Statistics Word Wall pages of SAMPLING METHODS, TYPES OF BIAS, & EXPERIMENTAL DESIGN vocabulary! Put them up one at a time as you teach through each term or display them all at once. 34 PAGESALL PAGES ARE IN COLOR & GRAYSCALE.SIZE: 8.5 x 11 inches All vocabulary terms are from Unit 3: Collecting Data in AP Statistics, and the
Subjects:
Grades:
10th - 12th
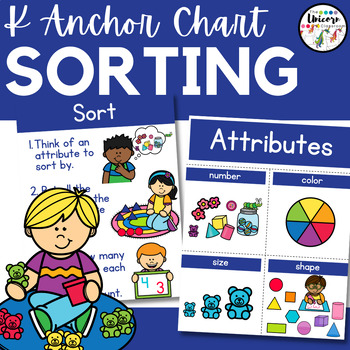
Sorting Poster and Anchor Chart | Kindergarten Math Data Unit
**This resource can be found WITHIN two other resources. If you want to purchase this product, consider purchasing a larger resource that it is found in- Kindergarten Math Yearlong Curriculum OR my Kingergarten ANCHOR CHART BUNDLE! <-- Grab the bundle at the DISCOUNTED price before I add all the resources. Also be sure to FOLLOW my store for more FLASH FREEBIES and 1/2 OFF discounts on new products.**Included in this resource are 2 posters / anchor charts to help you teach your kindergarten
Subjects:
Grades:
PreK - 1st
CCSS:
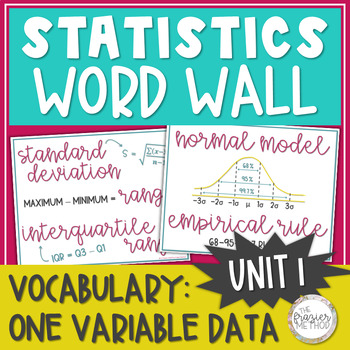
Statistics Word Wall Posters - Normal Model, Median, Mean, Skew, Z-Score Unit 1
Add some high school math classroom decor to your room or hallway with these great 8.5" by 11" statistics posters filled with statistics vocabulary, formulas, and graphs! These pages of AP Statistics decor can be displayed on any math word wall or math bulletin board! All vocabulary, formulas, and graphs are from Unit 1: Exploring One-Variable Data in AP Statistics, and the information on each slide aligns with AP College Board's objectives and standards for AP Statistics. ALL PAGES ARE IN COLOR
Subjects:
Grades:
10th - 12th
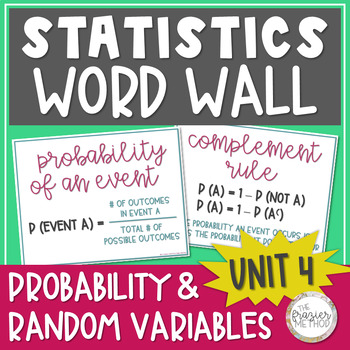
Statistics Word Wall Posters Probability Rules & Random Variables | AP Unit 4
High school math classroom décor made easy with these 8.5" by 11" pages of PROBABILITY RULES, PROBABILITY MODELS, & RANDOM VARIABLES vocabulary from Statistics! These can be displayed on any word wall or bulletin board in your math classroom or hallway. Put them up one at a time as you teach through each term or display them all at once. + 35 PAGES+ ALL PAGES ARE IN COLOR & GRAYSCALE.+ SIZE: 8.5 x 11 inches All vocabulary terms are from Unit 4: Probability & Random Variables, and the
Subjects:
Grades:
10th - 12th
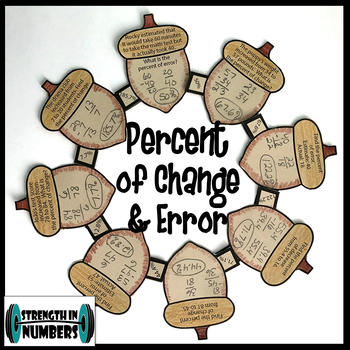
Percent of Change & Error Thanksgiving Fall Acorn Wreath
Your students will love this fall wreath. They will practice eight problems involving percent of error and change. Attaching each piece to the next piece with the correct answer makes a wreath. All my favorite things - self-checking, colorful, and wall-worthy! So adorable to display for Fall, especially Thanksgiving.Don't forget to earn TPT credits towards FREE products when you leave feedback! :)Check out my PAPER CHAINS:One and Two Step InequalitiesEaster – Solving ProportionsBasketball -
Subjects:
Grades:
6th - 9th
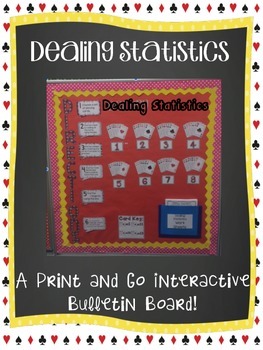
PRINTnGO INTERACTIVE MATH BULLETIN BOARD-Dealing Statistics
Dear teachers,Please enjoy Print and Go Interactive Math Bulletin Board-Dealing Statistics Edition. My students loved my interactive boards last year. They would find even the littlest minute working on them entertaining. I used mine last year as a station, or as a bell ringer, or even as an early finisher wall.This edition of the P&G Bulletin Boards is Dealing Statistics. Students are given instructions and a worksheet to write down answers on. Once this wall is set up, not only do you have
Subjects:
Grades:
5th - 7th
CCSS:
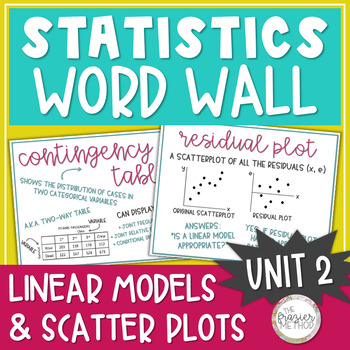
Statistics Word Wall Posters - Scatter Plot, Linear Model, Residual, Correlation
Use these Statistics Posters to add high school math classroom decor to your bulletin board, hallway, math word wall, or classroom door with these great 8.5" by 11" Statistics Word Wall pages filled with statistics vocabulary, formulas, and graphs! \Put them up one at a time as you teach through each term or display them all at once. All vocabulary, formulas, and graphs are from Unit 2: Exploring Two-Variable Data in AP Statistics, and the information on each slide aligns with AP College Board'
Subjects:
Grades:
10th - 12th, Higher Education
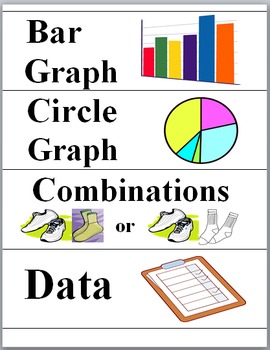
Statistics, Probability, Data and Graphs Illustrated Math Word Wall
The vocabulary and concepts included are sets, data, mean, medium, minimum, mode, range, survey, tally, charts, diagrams, graphs, key, probability, combinations, and tree diagrams.
This is an updated file.
Each of the 42 cards has a colorful illustration.
These cards can also be used as flashcards, Bingo Calling Cards, etc.
These Math Word Wall cards could be printed on card stock or photo paper and laminated, if desired.
*********************************************************************
Subjects:
Grades:
2nd - 6th
Also included in: Math Word Wall Bundle Grades 3, 4, 5
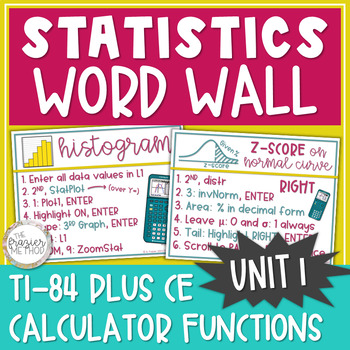
Statistics Word Wall Posters TI 84 Plus CE Calculator Box Plot Histogram Z-Score
Add high school math classroom decorations to your classroom bulletin board, hallway bulletin board, math word wall, or classroom door with these great 8.5" by 11" statistics posters filled with TI-84 CE CALCULATOR FUNCTIONS, such as graphing a histogram and boxplot, 5-Number Summary, area % under the Normal Model, and z-scores! All calculator functions are from Unit 1: Exploring One-Variable Data in AP Statistics, and the information on each slide aligns with AP College Board's objectives and s
Subjects:
Grades:
10th - 12th
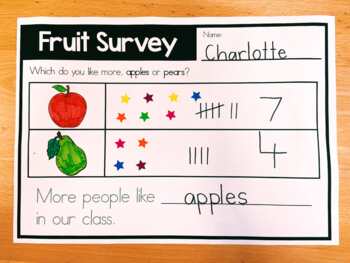
Graphing & Data Collection Class Survey Worksheets
This resource includes worksheets to help students practise graphing and data collection. Students will practise using tallies, collecting data by asking questions and recording and analysing data. This makes an adorable bulletin or board display!This resource can be used for whole-class 'tuning in' sessions or used individually or in small groups. There are Graphing and Data Collection File Contents:- 2 versions with 18 different survey options (one version with printed sentence and one with tr
Subjects:
Grades:
K - 3rd
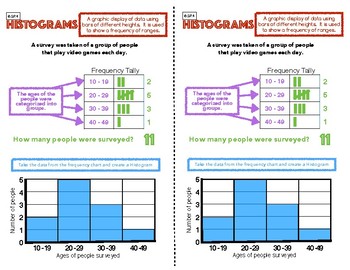
6.SP.4 Histogram Anchor Chart
Here's an anchor chart to show students how to display data using a Histogram. I have included a student copy of the chart. Cut along the dotted line and connect them using glue on chart paper.
Subjects:
Grades:
6th
Types:
CCSS:
Showing 1-24 of 137 results


