430 results
Common Core HSS-ID.A.1 resources under $5
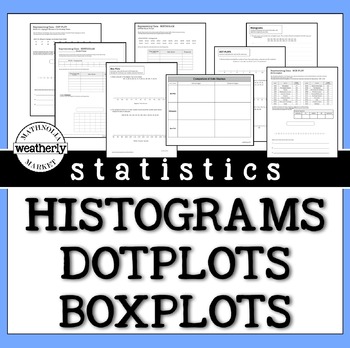
STATISTICS - Histograms, Dot Plots and Box Plots
There is no need to scour the internet for data. This resource includes the data and the format to challenge your students' skills with data displays.This packet includes worksheets that provide opportunities for students to create histograms, dot plots, and box plots.They can be used as guided practice or as "on your own" activities.INCLUDES3 worksheets with realistic data.3 worksheets with REAL data (Apple stock prices, US Olympic athlete ages, and the Oscars:Best Picture/ Movie Times)AND 3 wo
Subjects:
Grades:
6th - 9th
Types:
CCSS:
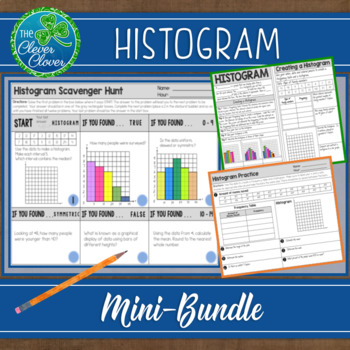
Histogram - Notes, Practice Worksheets and Scavenger Hunt
This histogram resource includes guided notes, a practice worksheet and a scavenger hunt. Your students will have the opportunity to create, interpret and discuss histograms. Below, you will find a detailed description of the notes, worksheet and scavenger hunt. Guided NotesThere are two small pages of guided notes. The first page provides the definition of a histogram and step by step instructions on how to create a histogram. The bottom portion of the notes has students examine three types (un
Subjects:
Grades:
6th - 9th, Adult Education
CCSS:
Also included in: Statistics Bundle - Guided Notes, Worksheets & Scavenger Hunts!
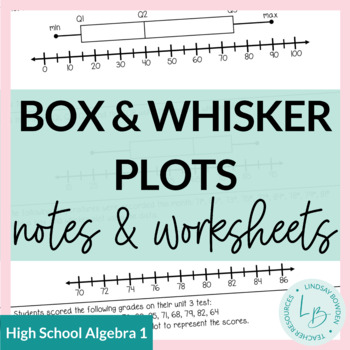
Box and Whisker Plots Notes and Worksheets
These notes and worksheets cover:RangeQuartiles and Interquartile RangeBox and Whisker PlotsIncludes 2 pages of notes and 2 worksheets. Answer keys included! These are meant for an Algebra 1 class, but can also be used for middle school (Texas standards for 7th grade). You may also like:Mean, Median, and Mode Notes & WorksheetsHistograms Notes & WorksheetsComparing Data: Spread, Shape, and Center Notes & WorksheetsTerms of Use:This product should only be used by the teacher who purch
Subjects:
Grades:
8th - 10th
CCSS:
Also included in: Statistics Unit Bundle

Box and Whisker Plots Whodunnit Activity - Printable & Digital Game Options
Nothing like a good criminal investigation to liven up box and whisker plots! Based off my popular CSI projects, I have created Whodunnits? The Whodunnits plan to focus on single content topics as opposed to units and will focus more on skill building than application. Every day can't be a project day, so Whodunnits can be an engaging out of their seat activity to practice important skills. In a Whodunnit?, students will work in teams to solve 10 practice problems that increase in difficult. Aft
Subjects:
Grades:
7th - 12th
Types:
CCSS:
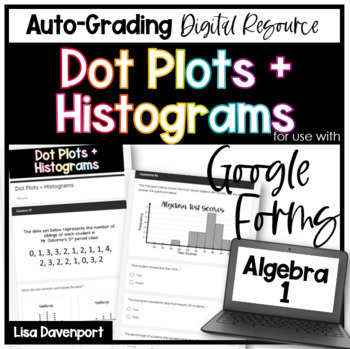
Dot Plots and Histograms Google Forms Homework
This 20-question, auto-grading Google Forms assignment provides students with practice constructing and analyzing data displayed in a dot plot or a histogram.Please note:Questions include a variety of types: "multiple-choice", "short response", "drop down", "select all that apply".Background knowledge includes mean, median, mode, range, and calculating percentages.This download also includes a PDF "worksheet" with the exact same questions as the Google Form. Just assign digitally or print + go!T
Grades:
6th - 9th
Types:
CCSS:
Also included in: Algebra 1 Google Forms Semester 2 Digital and Printable Homework Bundle
Statistics Project - Statistics Olympics
Engage your students in their study of statistics as they compete in self-created Olympic style events. This project will engage students and help them discover meaning and apply concepts including measures of central tendency, quartiles, outliers, variance, standard deviation, z-scores, box plots, histograms, normal and skewed distributions. This project can be completed in approximately 6-8 days (50-min class periods) ** March 2023 Update **Visual updates to all slides and documentsRubric ali
Subjects:
Grades:
6th - 12th
CCSS:
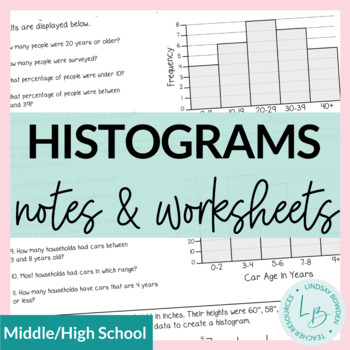
Histograms Notes and Worksheets
These histograms notes and worksheets are meant to be a review of histograms for an Algebra 1 statistics unit. They cover:Reading and Interpreting HistogramsCreating Histograms See preview to view all pages! 3 pages + answer keys. You may also like:Box and Whisker Plots Notes & WorksheetsTerms of Use:This product should only be used by the teacher who purchased it. This product is not to be shared with other teachers. Please buy the correct number of licenses if this is to be used by more th
Subjects:
Grades:
8th - 10th
CCSS:
Also included in: Statistics Unit Bundle
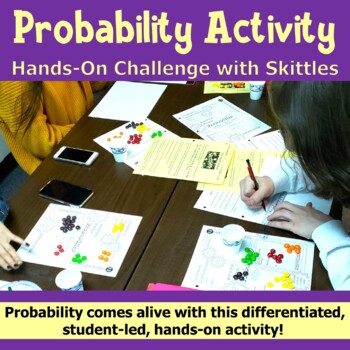
Probability Activity - Hands-On Challenge with Skittles - PBL with Math
Probability comes alive with this differentiated, student-led activity! The Skittles Probability Challenge provides practice using simple and compound probabilities in both theoretical and experimental fashion. Each student is given random data to work with. No two samples are identical. Students will: Make predictions based on logic.Determine the sample size of their personal data.Create a simple or two-way table to organize their data.Construct a graph or box & whisker plot to display the
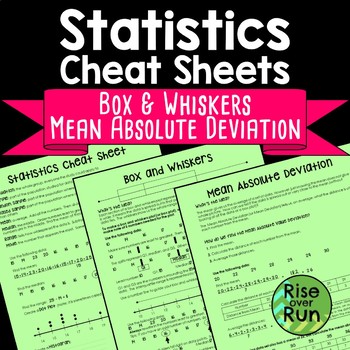
Box and Whiskers and Mean Absolute Deviation Cheat Sheets
Help students understand statistics vocabulary, dot plots, histograms, and box and whiskers diagrams, and mean absolute deviation with this resource.The three-page handout comes in two formats:Reference “Cheat Sheet” with all information filled in (pages 2-4)Guided Notes format with fill-in blanks and practice problems (pages 5-7)The first sheet defines important terms and helps students understand dot plots (or line plots) and histograms. The second sheet guides students in creating a box and w
Subjects:
Grades:
6th - 9th
Types:
CCSS:
Also included in: 7th Grade Math Activities, Lessons, Projects & More Bundle
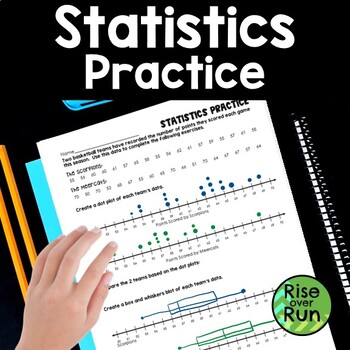
Box and Whiskers and Dot Plot Practice
Practice creating dot plots and box & whiskers plots with this statistics activity.Students are given scores for 2 basketball teams. They use the data to create a dot plot (or line plot) for each team and then a box and whiskers diagram for each team.Then, they compare the data of the teams.A bonus question asks students to calculate the mean absolute deviation.This worksheet can lead to great discussions about how to analyze box and whisker diagrams and make comparisons!
Subjects:
Grades:
6th - 7th
Types:
CCSS:
Also included in: Algebra 1 and 8th Grade Math Curriculum Bundle for Entire Year
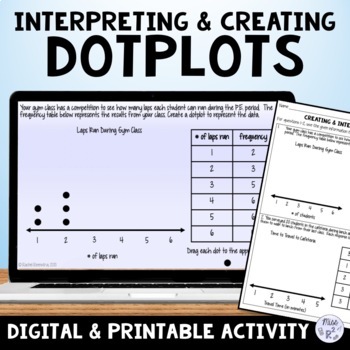
Creating and Interpreting Dot plots Practice Activity
In this digital and printable practice activity, students will create and interpret dotplots. For the digital version of this activity, students will drag and drop and type in answers in Google Slides. Slides 1-2: Create DotplotSlides 3-5: Interpret Dotplots - answer questions using a dotplotA printable worksheet version of this activity is included. An answer key is provided for both activities. You must have a free Google account to access the activity. When you purchase, a file will be adde
Subjects:
Grades:
6th - 9th
Types:
CCSS:
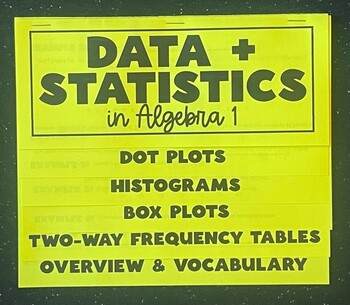
Data and Statistics in Algebra 1 Foldable Notes - Fully Editable
This editable algebra 1 foldable provides an introduction and overview for most of the univariate and bivariate data and statistics taught in the Algebra 1 standards. It is organized by the following tabs:Dot PlotsHistogramsBox PlotsTwo-Way Frequency TablesOverviewWithin the foldable there are at least two examples for each type of graph. It also allows for you to review/ address the following terms: mean, median mode, range, interquartile range, outliers, standard deviation, marginal and joi
Grades:
8th - 10th
CCSS:
Also included in: Data Analysis and Statistics Foldable Bundle
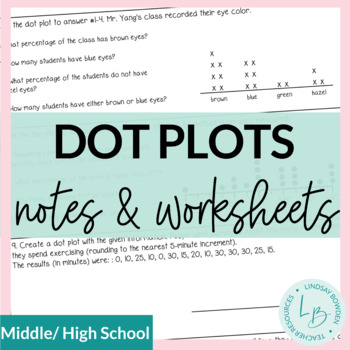
Dot Plots Notes and Worksheets
These dot plots notes and worksheets are meant to be a review of dot plots for an Algebra 1 statistics unit. They cover:Reading and Interpreting Dot PlotsCreating Dot PlotsSee preview to view all pages! 2 pages + answer keys.You may also like:Box and Whisker Plots Notes & WorksheetsHistograms Notes and WorksheetsTerms of Use:This product should only be used by the teacher who purchased it. This product is not to be shared with other teachers. Please buy the correct number of licenses if this
Subjects:
Grades:
8th - 10th
CCSS:
Also included in: Statistics Unit Bundle

High School Data Analysis Project
This project covers a large range of data analysis methods. There are eleven total parts to the project.
Part One: the students have to collect data from 20 students outside of the classroom. Directions specify to ask students from each grade level.
Part Two: Measures of Center and Variation. Students will calculate mean, median, mode, range, and standard deviation for some of the data collected. Definitions of each term are included.
Part Three: Box-And-Whisker Plot. Students will create t
Subjects:
Grades:
9th - 12th
Types:
CCSS:
Home Prices: High School Statistics Project
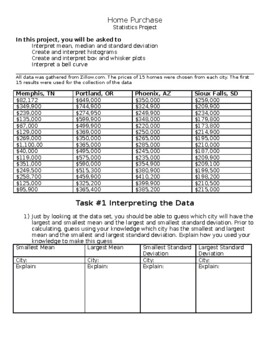
This statistics project has students exploring home prices and using their knowledge of mean, median, standard deviation, histograms, box and whisker plots, and bell curves to make predictions and inferences about the data. This project is provided in a word document to allow the teacher the ability to edit the document or load it to a google doc. In this project students first make predictions about measures of spread and central tendency without calculating but by looking at the data. Students
Subjects:
Grades:
9th - 12th
Types:
CCSS:
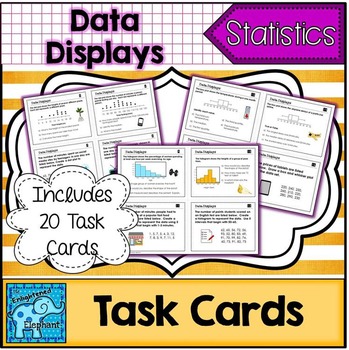
Data Display Task Cards
There are 20 total task cards, a student recording sheet and answer key. These tasks meet HSS.ID.A.1, HSS.ID.A.3, HSS.ID.B.6
There are 4 questions for each of the following types of data displays:
dot plots
stem and leaf plots
histograms
box plots
scatter plots
Students will be asked to read and interpret each type of data display as well as create each type of data display from a contextual set of data.
Use task cards at centers or stations, for entrance and exit tasks and for activities lik
Subjects:
Grades:
7th - 10th
Types:
CCSS:

Dot Plots, Histograms, and Box Plots Quiz for Google Forms™ - 6.SP.4
About This Resource:This is a Google Forms Quiz on creating and interpreting dot plots, histograms, and box plots. The instructions are easy to follow for you to make a copy of the quiz to your Google Drive. Then you can assign to your students using Google Classroom or some other method.Questions on this assessment were carefully created to give our students the best practice on the following standard.6.SP.4 - Display numerical data in plots on a number line, including dot plots, histograms, an
Subjects:
Grades:
6th - 10th
Types:
CCSS:

Box Plots Google Forms Homework
This 8-question (35-part), auto-grading Google Forms assignment provides students with practice constructing and analyzing data displayed in a box plot.Please note:Questions include a variety of types: "multiple-choice", "short response", "drop down", "select all that apply".The following material is assessed.Calculate the 5- number summary- minimum, first quartile, median, third quartile, maximum.Calculate the 5- number summary and use it to match a data set with its graph.Calculate interquarti
Grades:
7th - 9th
Types:
CCSS:
Also included in: Algebra 1 Google Forms Semester 2 Digital and Printable Homework Bundle
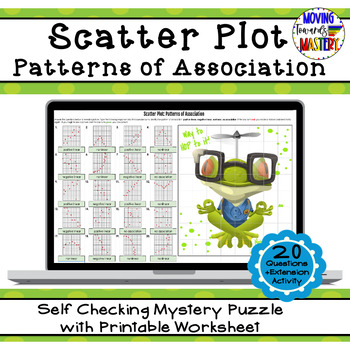
Scatter Plot: Patterns of Association Self Checking Mystery Picture
Engaging math self checking review activity to practice identifying patterns of association for scatter plots.This self-checking activity will allow students to practice identifying patterns of association for scatter plots. Students will use their understanding of scatter plots to answer questions to reveal pieces of a mystery puzzle as they work, just like a pixel art activity! If students answer incorrectly, the box will turn red and NO picture pieces will be revealed. This resource include
Subjects:
Grades:
7th - 10th
Types:
CCSS:
Also included in: 8th Grade Math Common Core Growing Bundle
Constructing Box-and-Whisker Plots - Stations Activity
About This Resource:In this activity students will practice constructing box-and-whisker plots when provided a data set. Students will need to calculate the five number summary (minimum, first quartile, median, third quartile, and maximum) in order to be successful on this activity. The prep required by the teacher consists of printing the stations cards, making a copy of the graphic organizer for each student, and setting the expectations and instructions with their students.Your students will
Subjects:
Grades:
6th - 12th
Types:
CCSS:
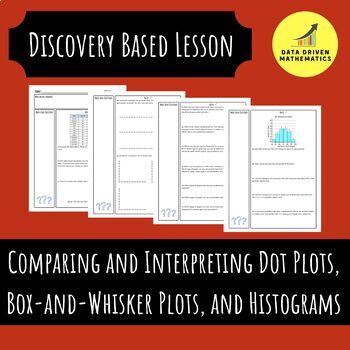
Comparing and Interpreting Dot Plots, Box-and-Whisker Plots, and Histograms
About This Resource:A four page packet containing an investigation into comparing and interpreting dot plots, box-and-whisker plots, and histograms. In addition, you will receive the answer key to help with the implementation of this activity in your classroom. The worksheet flows perfectly and could be used in more of a discovery format or a instructor guided notes.What's Included:You will receive a zipped folder. Inside the zipped folder is a worksheet and the answer key in PDF format.Similar
Subjects:
Grades:
6th - 10th
CCSS:
Box and Whisker Plots Worksheet
Hello Math Teachers! Are you looking for a fun and engaging way to teach your students about Box and Whisker Plots? Our baseball-themed worksheet is perfect for middle school and algebra classes, as well as any statistics unit.This comprehensive worksheet includes both single and double box plots, and is designed to help students progress from interpreting box plots with quartiles, interquartile range, range, and median to constructing their own box plots. The two-sided worksheet comes with an e
Subjects:
Grades:
7th - 8th
Types:
CCSS:
Also included in: Data and Statistics Worksheets Bundle

Linear Regression | TI-84 Graphing Calculator plus Applications
This clear, concise, step by step notes help your students use the TI 83 and TI 84 Graphing Calculator to enter data into lists, create a linear regression equation and to plot the equation along with the data simultaneously. Also included is a 3 page worksheet with five real world examples for students to practice. Solutions included. These can be used as Binder Notes or printed smaller for Interactive Notebooks._________________________________________________Related Products★ Quadratic Re
Subjects:
Grades:
9th - 11th, Higher Education
Types:
CCSS:
Also included in: Linear Functions and Systems Algebra 2 Unit 2 Activity Bundle

Standard Deviation Whodunnit Activity - Printable & Digital Game Options
Nothing like a good criminal investigation to liven up standard deviation! Based off my popular CSI projects, I have created Whodunnits? The Whodunnits plan to focus on single content topics as opposed to units and will focus more on skill building than application. Every day can't be a project day, so Whodunnits can be an engaging out of their seat activity to practice important skills. In a Whodunnit?, students will work in teams to solve 10 practice problems that increase in difficult. After
Subjects:
Grades:
7th - 12th
Types:
CCSS:
Also included in: Measures of Center & Variance Unit Bundle - Distance Learning Compatible
Showing 1-24 of 430 results

