68 results
Free Common Core HSS-ID.A.1 resources
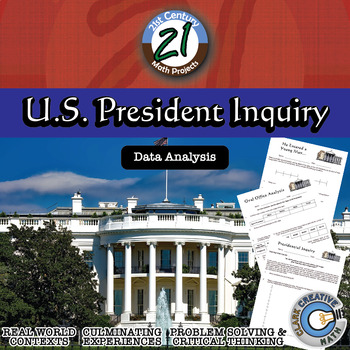
U.S. President -- Data Analysis & Statistics Inquiry - 21st Century Math Project
Engage students in data analysis through use of Presidential data in this 21st Century Math Project. Students will create box and whisker, stem and leaf, histograms and scatterplot through their investigations. In the end, students will take on the inquiry question: "Do US Presidents with the most children live longer after they have been inaugurated?" ***THIS PRODUCT HAS BEEN UPDATED WITH A GOOGLE SLIDES INTERACTIVE VERSION INCLUDED. REDOWNLOAD IF YOU HAVE IT ALREADY***-- In "He Entered a Youn
Subjects:
Grades:
6th - 12th
Types:
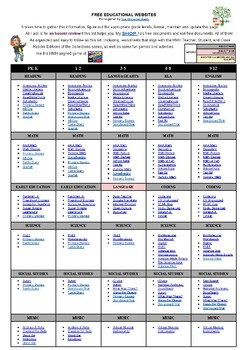
FREE EDUCATIONAL WEBSITES LIST 4 ALL GRADES K-12 AND SUBJECTS + TEACHER RESOURCE
Sometimes, you just need a list of websites for everyone. Here it is. FREE EDUCATIONAL WEBSITES Put together by Teach Me, Maria!It takes time to gather this information, figure out the appropriate grade levels, and format, maintain, and update this page. All I ask is for an honest review if this list helps you.
Subjects:
Grades:
PreK - 12th, Staff
Types:
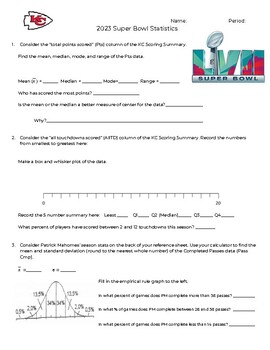
2023 Super Bowl Statistics Activity
This activity contains two stats sheets - one for the Philadelphia Eagles and one for the Kansas City Chiefs. Students are asked to use the data from the various tables to answer questions about the teams. This activity covers 1 variable statistics (mean, median, mode, range, standard deviation, box-and-whisker plot, histogram, two-way tables).This would be great as a partner activity or class activity.
Subjects:
Grades:
7th - 12th
Types:
CCSS:
Statistics: Plots, Shapes of Distributions, Choosing Mean or Median
Statistics Integrated Review: Plots, Shapes of Distributions, and Statistics for Center and SpreadUse common data plots to determine shape of the data distribution, and choose appropriate statistics for center and spread. This product includes a one-page integrated review with a worksheet and answer key aligned with the common core. Students practice identifying the shape of a data distribution using common data plots (dot plot, histogram, and boxplot). Students also review how to choose appropr
Subjects:
Grades:
8th - 12th
Types:
CCSS:
Also included in: Bundle: Algebra 1 Statistics Unit Curriculum (Common Core)
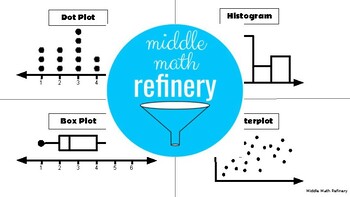
Printable: Types of Graphs (Dot Plot, Histogram, Box Plot, Scatterplot)
This easy-to-use resource features the four (4) types of graphs students learn about in middle school math and high school statistics: dot plots, histograms, box (or box and whiskers) plots and scatterplots. Great to use for scaffolded notes or on your word wall!Features:One (1) blank/ fillable page with missing names of graphsAnswer key with labels
Subjects:
Grades:
6th - 10th
CCSS:
Statistics Activity Bar Graphs and Dotplots FREE
Fun with StatisticsExplore one variable data using M&M™ candy In this activity, students will use a fun size bag of M&Ms to create a bar graph; they will use the class data to create a class bar graph; and they will use the class individual data to create 6 separate dot plots. Students will then be asked about the difference between the bar graph and the dot plot that they created from the same data. There is also an extension on this activity, that asks students to create a pie graph by
Subjects:
Grades:
10th - 12th
Types:
CCSS:
Also included in: Statistics Chocolate Candy Activity Bundle
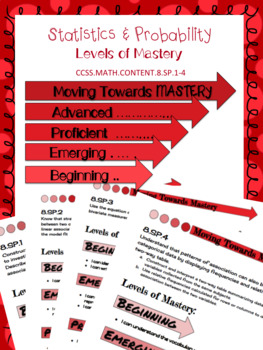
8.SP Scatter Plot & Two-Way Table Levels of Mastery
This product was created to use as an introduction to teaching the eighth grade statistics and probability standards. It allows students to evaluate themselves throughout the process of teaching the standards. It can be printed and provided to each student or printed as posters to be hung in the classroom for easy reference.
Levels of mastery are:
→ Beginning
→ Emerging
→ Proficient
→ Advanced
Levels of Mastery Posters:
★ 8.SP.1 Constructing & Interpreting Scatter Plots
★ 8.SP.2 Line of
Subjects:
Grades:
8th, Higher Education
Types:
CCSS:
Also included in: 8th Grade Math Common Core Growing Bundle
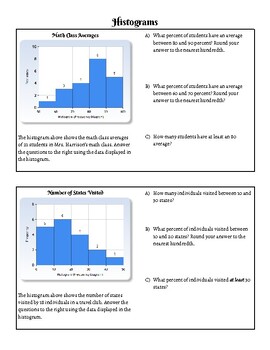
Histogram Practice Sheet
Aligned to the Algebra 1 NYS Next Gen Learning Standards- NY-6.SP4: Display quantitative data in plots on a number line, including dot plots, and histograms.This is a practice sheet to help students master histograms. Students will interpret the data from two histograms, and then construct their own histogram to represent a set of data. Designed to take about 20 minutes to complete
Subjects:
Grades:
Not Grade Specific
Types:
CCSS:
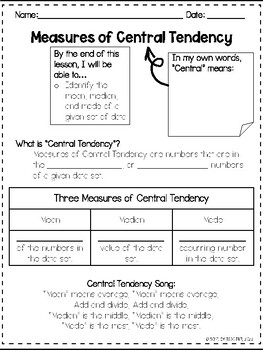
Statistics: Measures of Central Tendency Notes & Practice
Students will be learning how to solve for the mean, median, mode and range of a given data set through guided notes. There is a practice at the end for them to work on independently.
Subjects:
Grades:
6th - 9th
Types:
CCSS:
Common Core Algebra I - Unit #10.Statistics
Standard statistical displays of data are reviewed at the beginning of the 10 lesson unit. Box plots are used to compare data sets and emphasize use of the quartiles and interquartile range. Measures of central tendency and dispersion, such as mean and standard deviation, are discussed and interpreted in real world scenarios. Two way frequency charts are used to compare data and bivariate data analyses allow the fitting of data with linear and exponential functions.To access the lesson videos on
Subjects:
Grades:
8th - 10th
CCSS:
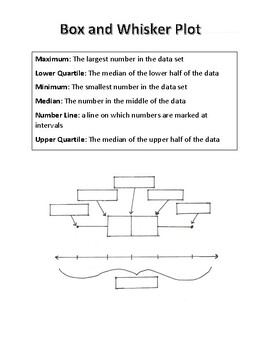
BOX AND WHISKER PLOT vocabulary label graphic organizer
Diagram of Box and Whisker Plots to label with vocabulary word bank (including definitions)
Subjects:
Grades:
8th - 9th
Types:
CCSS:

Introduction To Investing for High School
This lesson is designed to provide high school students with a comprehensive introduction to the world of investing. Students will learn about different types of investments, such as stocks, bonds, and mutual funds, and how to evaluate the risks and potential returns associated with each. I want students to have a better understanding of how to set and achieve financial goals, and how to start planning for their financial future through different investment options.
Subjects:
Grades:
9th - 12th, Higher Education, Adult Education
Types:
CCSS:
NGSS:
HS-ESS3-1
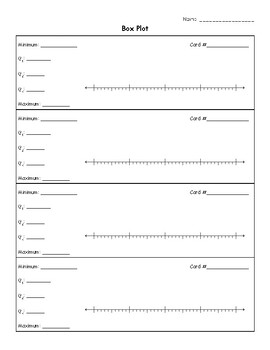
Creating box and whisker plots Card Activity
This low-prep set includes 16 cards that are perfect for practice. With minimal prep required, your students will practice and build these skills in a fun, engaging and out-of-their seat activity perfect for supplementing any lesson. 16 Cards 1 recording sheets Answer KeyYour students will love reinforcing their knowledge of box and whisker plots while they are out of their seats and having fun. They will be moving around and you will be keeping math fun! No additional materials are needed, bu
Subjects:
Grades:
6th - 9th
Types:
CCSS:
10 Free Big Brain Math Problems
This is a sample of the 100 and 180 Big Brain Math Problem I have created with a couple of my students. I write these problems on the window of my classroom everyday and get about 5-10 students a day coming to try to solve them. It's been an enjoyable experience to have students come try the problem of the day and share their solutions with me. Please consider purchasing the 100 or 180 Big Brain Math Problems. There's enough for one a day for the entire school year and range from 1-5 Star diffic
Subjects:
Grades:
9th - 12th
Types:
CCSS:
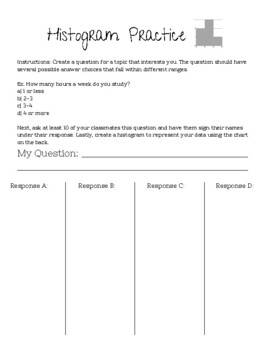
Class Histogram Activity
A fun class activity to practice making histograms using student's own questions! Students create their own survey question, poll their classmates, and construct a histogram to represent the data.
Subjects:
Grades:
6th - 10th
Types:
CCSS:
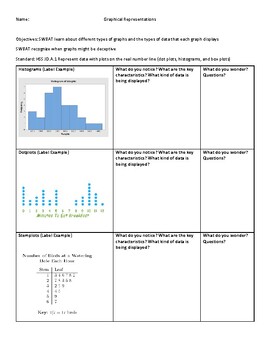
Categorizing Data Visualizations Notice and Wonder Activity
This activity will help students identify the key characteristics or various graphs and what type of data (i.e. quantitative or categorical) each graph displays.
Grades:
5th - 12th
CCSS:
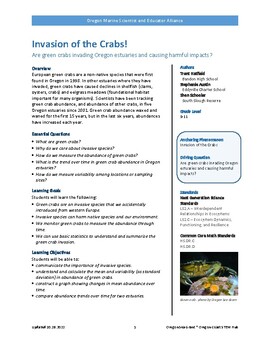
Invasion of the Crabs! Lesson Plan and Activities
Are green crabs invading Oregon estuaries and causing harmful impacts?This lesson plan from Oregon Sea Grant includes:Introduction lesson with video resources"Introduction to Invasive Green Crabs in Oregon" activity with narrated presentation and slides, and handouts"Species on the Move" activity with article and worksheet"Green Crab Abundance" activity with student dataset handout and worksheet, and teacher guidance and answer key"Data analysis" activity for student presentations of dataField t
Subjects:
Grades:
9th - 11th
Types:
CCSS:
NGSS:
HS-LS2-7
, HS-LS2-2
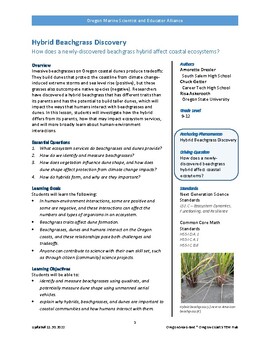
Hybrid Beachgrass Lesson Plan and Activities
How does a newly-discovered beachgrass hybrid affect coastal ecosystems?This lesson plan by Oregon Sea Grant includes:"Discovering New Organisms" activity with vocabulary handout, and lesson presentation"Life Imitating Art" activity with reading source"Dunes of Ecology" activity with presentation and handout"Hybrid Beachgrass Discovery" activity with video, handout, field project, and classroom project"Career Connections" activity with internet resource and handout"Visualizing Data" activity wit
Subjects:
Grades:
9th - 12th
Types:
CCSS:
NGSS:
HS-LS2-3
, HS-LS2-7
, HS-LS2-5
, HS-LS2-4
, HS-LS2-1
...
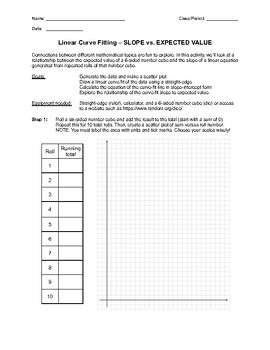
Linear Curve Fitting - Slope versus Expected Value
Connections between different mathematical topics are fun to explore. In this activity, we’ll look at a relationship between the expected value of a 6-sided number cube and the slope of a linear equation generated from repeated rolls of that number cube.
Subjects:
Grades:
9th - 12th
Types:
CCSS:
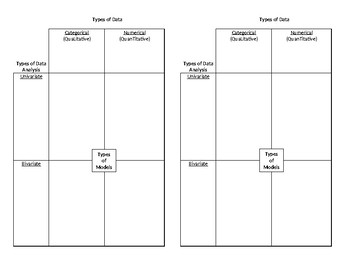
Intro to Data Analysis Graphic Organizer
I created this template for an introduction to my data analysis unit in Algebra I. We discuss and define categorical vs. numerical data, univariate vs. bivariate analysis, and the different graphs or models that apply to each. Since we use Interactive Notebooks, it is designed to be half a page.
Subjects:
Grades:
7th - 12th
CCSS:

Histograms on the TI-84 Graphing Calculator Reference Sheet Freebie
FREEBIE Statistics Creating Histograms on the TI 83 84 PlusThis easy to follow handout helps your students learn to use the TI 83 - 84 Plus Graphing Calculator to enter data into lists and create histograms from a list of data, and to customize them. Great for Algebra, Statistics, AP, Regular and Dual Enrollment, and for the SAT. There are two versions, one for the TI 83 Plus and the second supports for newer OS of the TI 84 Plus.These can be used as Binder Notes or printed two to a page for
Subjects:
Grades:
9th - 11th
CCSS:
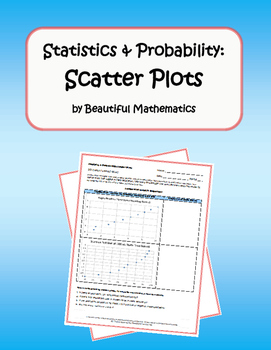
Statistics & Probability: Scatter Plots
Students will learn that straight lines are widely used to model relationships between two quantitative variables. For scatter plots that suggest a linear association, informally fit a straight line, and informally assess the model fit by judging the closeness of the data points to the line.Provide feedback and get TPT credit on future purchases:***Go to your My Purchases page. Click on the Provide Feedback button beside each purchase. You will be taken to a page where you can give a quick ratin
Subjects:
Grades:
7th - 9th
CCSS:

Oh So Sweet Statistics - A Histogram Project
Give students the unique opportunity to not only create their own statistics, but reflect on their own progress too! We started with an estimation station each week, where I filled a new size jar with a different candy across three weeks. The student who had the lowest absolute deviation from the actual amount of candy in the jar - WON THE WHOLE JAR! After three weeks, we had more than enough candy and data to peak their interest. Students now get to use the results to engage with one variable s
Subjects:
Grades:
8th - 10th
Types:
CCSS:
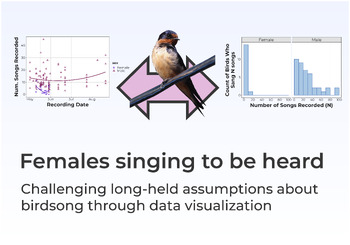
Females Singing To Be Heard: Interdisciplinary Science Mini-Unit
This FREE, interdisciplinary mini-unit is all about challenging long-held assumptions about birdsong through data visualization. The Gist: Students will learn how data visuals tell a story. They will analyze real bird song data to try to understand why female singing behavior has been overlooked in one of the most common birds in the world. They will also gain a deeper insight into the scientific peer review process.Driving Questions: What is the best way to visualize data?How do our assumption
Grades:
5th - 12th
CCSS:
Showing 1-24 of 68 results

