Creating and Interpreting Dot plots Practice Activity
Miss R Squared
110 Followers
Grade Levels
6th - 9th
Subjects
Resource Type
Standards
CCSS6.SP.B.4
CCSSHSS-ID.A.1
Formats Included
- Google Drive™ folder
Pages
5 slides
Miss R Squared
110 Followers

Made for Google Drive™
This resource can be used by students on Google Drive or Google Classroom. To access this resource, you’ll need to allow TPT to add it to your Google Drive. See our FAQ and Privacy Policy for more information.
What educators are saying
My students enjoyed this. Students stayed engaged and felt successful in reaching their learning goals.
Description
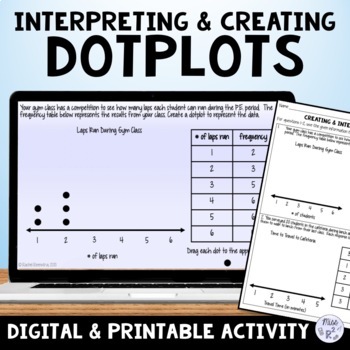
In this digital and printable practice activity, students will create and interpret dotplots. For the digital version of this activity, students will drag and drop and type in answers in Google Slides.
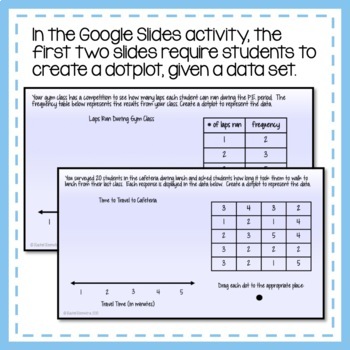
Slides 1-2: Create Dotplot
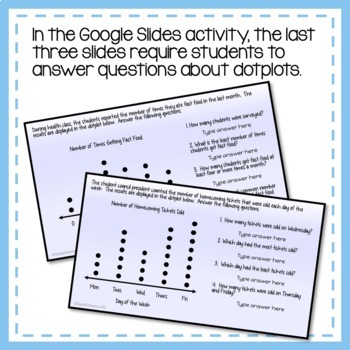
Slides 3-5: Interpret Dotplots - answer questions using a dotplot
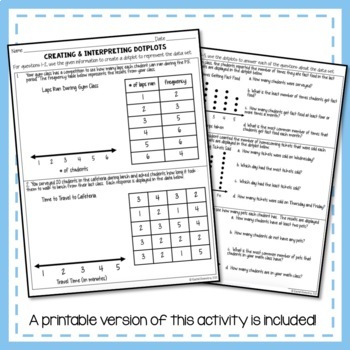
A printable worksheet version of this activity is included. An answer key is provided for both activities.
You must have a free Google account to access the activity. When you purchase, a file will be added to your Google drive with a student version of the activity as well as an answer key version.
Total Pages
5 slides
Answer Key
Included
Teaching Duration
30 minutes
Report this resource to TPT
Reported resources will be reviewed by our team. Report this resource to let us know if this resource violates TPT’s content guidelines.
Standards
to see state-specific standards (only available in the US).
CCSS6.SP.B.4
Display numerical data in plots on a number line, including dot plots, histograms, and box plots.
CCSSHSS-ID.A.1
Represent data with plots on the real number line (dot plots, histograms, and box plots).


