183 results
Adult education statistics resources $5-10
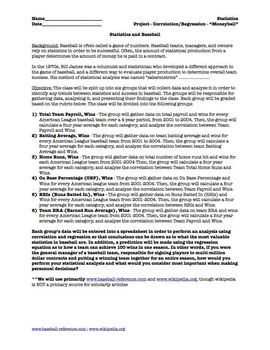
Statistics Correlation and Regression Project for Movie "Moneyball" (5 day)
Prerequisite: Correlation and Regression (Linear). This is a project that divides a statistics class into 6 groups and students do ACTUAL data collection from given websites and they perform their OWN ANALYSIS. They will use computers/internet/excel/spreadsheets/graphing calculators to evaluate correlation. If you have interest in baseball and statistics, this is a great project to get the class interested, and covers about 5 days, plus you can watch the movie "Moneyball" afterwards as a reward.
Subjects:
Grades:
10th - 12th, Higher Education, Adult Education
Types:
Food Waste and Mathematics: From Farm to Table to Dump
Here's a very uncomfortable fact: it takes 4 pounds of potatoes to make 1 pound of potato chips. That means that for every 1 pound bag of potato chips you eat, 3 pounds of potatoes have to be thrown away. What a waste of food! This is a series of activities that looks at the hidden world of food waste. It includes a look at how much food is wasted as it is "processed" into finished products like french fries and potato chips. It also includes mathematical activities where students calculate how
Subjects:
Grades:
5th - 12th, Adult Education
Types:
Crash Course Statistics Episodes #1-5 (Central Tendency, Charts, and Graphs)
Distance Learning - #distancelearning Online Resources - #onlineresourcesEpisode Guides for Crash Course Statistics YouTube Series!Each guide comes with two versions (with and without timestamps), and a complete answer key.This product easy to use, no-prep product is a perfect last minute lesson plan, review activity, extra "filler" to keep on hand, substitute lesson plan, or homework assignment.*Great AP test prep!Plus it's only $1 per episode!-Answer key included for every episode guide-Questi
Subjects:
Grades:
9th - 12th, Higher Education, Adult Education
Types:
Also included in: Crash Course Statistics Episodes #1-25 BUNDLE
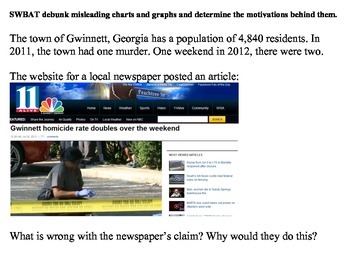
Misleading Charts and Graphs (Statistics)
Teaching students to deduce information provided in charts and graphs is an essential part of any math curriculum.
However, what do you do when the graph itself provides misleading or false information?
This lesson is a good way to get students to look critically at graphically displayed data and see through those who try to manipulate data for their own purposes.
Subjects:
Grades:
7th - 12th, Higher Education, Adult Education
Types:
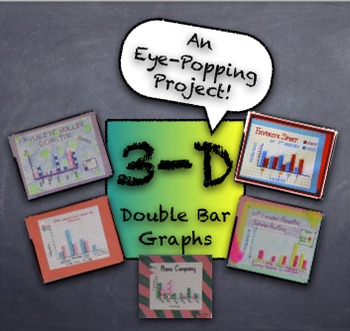
3-D Double Bar Graphs PROJECT from Student Generated Survey Data - Fun Project
This project creates quite an impressive product with simple supplies easily accessible in any classroom. Students generate data from surveys given to peers, using simple questions like, "What's your favorite pizza topping?" Students use survey results to create a 3-dimensional "girls versus boys" double-bar graph. Using centimeter graph paper, markers, and glue sticks, the double-bar graph projects are truly eye-popping! Project description, survey information, and graph assembly instructio
Subjects:
Grades:
3rd - 12th, Adult Education
Types:
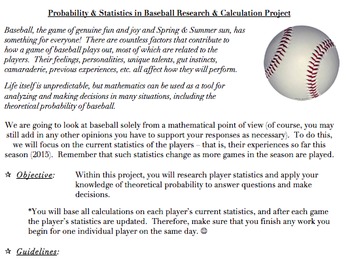
Probability & Statistics in Baseball Project (Common Core Aligned, AND FUN!)
The problems and activities within this document are designed to assist students in achieving the following standards: 6.SP.B.5, 7.SP.C, HSS.CP.A.2, HSS.CP.A.3, HSS.CP.B.7, HSS.CP.B.9, as well as the standards for mathematics practice and the literacy standards. They are also designed to help the teacher assess the students’ abilities when it comes to working with the ideas within the standards.This document contains the following:A project designed to allow students to investigate theoretical
Subjects:
Grades:
5th - 12th, Higher Education, Adult Education, Staff
AP Psych / AP Psychology - Unit 1: Scientific Foundations - Activity Pack!
Includes the wildly popular ESCAPE ROOM Activity, as well as analyzes and practices nearly all standards regarding Unit 1: Scientific Foundations of Psychology, including 1.B, 1.C, 1.E, 1.F, 1.G, 1.H, 1.I, 1.J, 1.L, 1.M, 1.N, and 1.O!In class or as homework, students must assess, analyze, graph, calculate, and interpret data regarding psychological studies. All questions are original, and modeled after the College Board format and difficulty. After learning about the topics in class, these are
Subjects:
Grades:
8th - 12th, Higher Education, Adult Education, Staff
Types:

Cell Cycle/Mitosis and Chi-Squared Analysis Activity and Answer Key
Answer key and activity packet included!What's better than a cell cycle and mitosis review? A cell cycle and mitosis review that also has students complete a chi-squared analysis of data!Students will run through a lab-based scenario to help review the steps of the cell cycle and mitosis. They will also been given data based on this scenario and complete a full chi-squared analysis, including null and alternate hypotheses, using the chi-square critical values table, completing the calculations f
Subjects:
Grades:
9th - 12th, Higher Education, Adult Education
Types:
Statistics Unit 3--Measures of Position
Unit 3: Measures of Position3.1 Quartiles3.2 Percentiles3.3 Z-ScoresUnit 3 ReviewUnit 3 TestThis course is designed for a high school classroom. It's meant to be an informative and fun general statistics course covering:1. Descriptive Statistics2. Study Design3. Probability4. A selection of Inferential Statistics
Subjects:
Grades:
9th - 12th, Higher Education, Adult Education
Types:
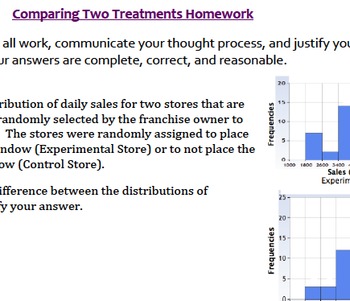
Data Analysis & Statistics Bundle (Ideal for Algebra II) Common Core High School
The problems and activities within this document are designed to assist students in achieving the following standards: S.ID.4, S.IC.1, S.IC.2, S.IC.3, S.IC.4, S.IC.5, S.IC.6, S.CP.A.2, S.CP.A.3, and S.CP.A.5, as well as the standards for mathematics practice and the literacy standards. They are also designed to help the teacher assess the students’ abilities when it comes to working with the ideas within the standards.
This folder contains the following:
- Introduction to data, statistics, and
Subjects:
Grades:
6th - 12th, Higher Education, Adult Education, Staff
Types:
Data Analysis Statistics and Probability worksheets (63 Problems) (SAT Review)
Data analysis statistics and probability worksheets ,63 problemsSAT ReviewFraction and Data (29 Multiple choice questions)Statistic Problem (15 questions)Probability Word Problems This section contains 19 word problems about :Simple ProbabilityCounting PrincipleIndependent ProbabilityDependent ProbabilityMutually Exclusive EventsPermutationsCombinationsConditional Probability* AlSO AVAILABLE FOR YOU OR A COLLEAGUE! - CLICK ANY LINK YOU WANT:Number and Operations (SAT Review) Algebra & Functi
Subjects:
Grades:
7th - 12th, Higher Education, Adult Education, Staff
Types:
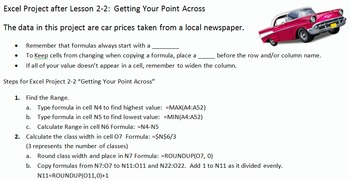
Excel Projects for Statistics Frequency Distributions and Charts
This file contains three different projects with solutions and a quick reference card for students. It correlates to Bluman's Elementary Statistics textbook.
First is an Introduction to Excel. There is an example, guided practice and then 4 Projects. The instructions are on each sheet. The topics covered are: basic editing and formatting, beginning charts, beginning formulas, such as SUM and AVERAGE, and calculations. There is an editable grading rubric for this project. The Preview file
Subjects:
Grades:
8th - 11th, Higher Education, Adult Education
Types:
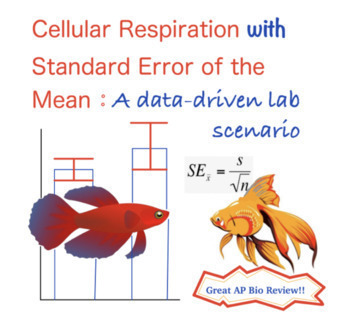
Cellular Respiration Think-it-Through Lab with Standard Error
This activity allows students to review basic concepts of cellular respiration in the context of a lab scenario. Students will work with data and complete calculations including percent change, mean, standard deviation, and standard error. In addition, students will see how error bars are drawn and learn how to interpret them on a graph. Activity A: Introduction (background, lab design, etc)Activity B: Working with data (percent change and mean calculations)Activity C: Calculating standard e
Subjects:
Grades:
9th - 12th, Higher Education, Adult Education
Types:
Also included in: Cell Resp Think-It-Through Lab with Standard Error and Answer Key
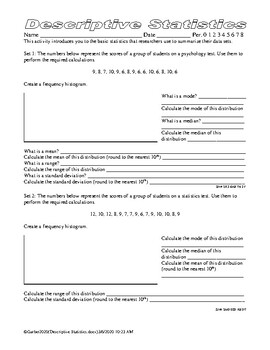
Statistics Descriptive Statistics Mean Median Mode Standard Deviation
I was inspired to build these practice sheets by a PsychSim assignment I saw on descriptive statistics. Of course, like a lot of commercial junk it took multiple pages and there was only one practice problem. In this set we have 2 per page and every single one is different. You limit plagiarism by making everyone’s problem set different.There are 200 unique pages in this set....a large collection at pennies a page.A disguised partial key is actually contained for every problem set! The "serial n
Subjects:
Grades:
8th - 12th, Higher Education, Adult Education
Types:
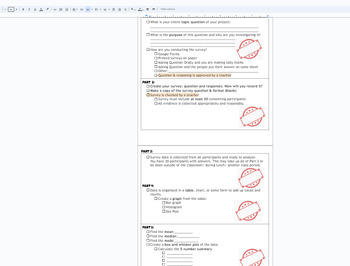
Statistics Survey project Discovery (broken down into sections) with Rubric
This is a broken down (scaffolded) packet of instructions/ guide for a Stats Project for Math 1 HS or 8th grade students. The goal of the project is for students to take a statistical survey on quantitative data (numbers) of their choice. Using this data from the survey, the following will be included in the project:Survey- the question being askedSurvey responses (requirement of 30)Data organization: Bar chart, Histogram, Dot PlotMeanMedianModeBox and Whisket Plot5 number summary (Q1,Q2,Q3, min
Subjects:
Grades:
7th - 12th, Higher Education, Adult Education
CCSS:

Normal Distribution Foldable Popup
This is a popup of a normal distribution graph, showing students the probable spread of data within 1, 2, 3, and 4 standard deviations of the mean. The formulas for the population standard deviation and the sample standard deviation are both included. It is a great reference/graphic organizer for student notebooks and I have even had students who weren't in my class ask to join because they wanted this popup too. Useful for math or maths class, great for visual and kinesthetic learners, and
Subjects:
Grades:
9th - 12th, Higher Education, Adult Education
CCSS:

Misleading Statistics
Did you know that 90% of all serial killers are right-handed?
Well, of course... 90% of all people in general are right-handed.
This is a great activity that can be used as an introduction to any statistics class or unit. It makes students think about how people misinterpret statistics and how two people can look at the same data and draw different conclusions.
Subjects:
Grades:
7th - 12th, Higher Education, Adult Education
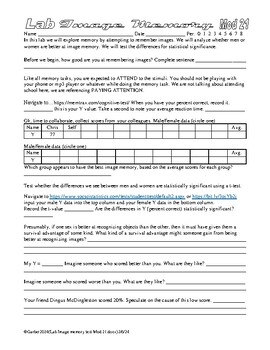
Psychology Lab Image Memory and Sex Differences AP Psychology Statistics
In this set of 13 labs the students do a variety of image memory tasks. They then collaborate and share data, then perform a T test on the data to find out if the differences between the scores of men and women are statistically significant. The students also test for correlations between a variety of scores. I suppose it is a sort of an expansion on my face memory lab. Links sometimes die, so try before you buy… https://www.psychologytoday.com/us/tests/iq/memory-test https://memtrax.com/cogniti
Subjects:
Grades:
9th - 12th, Higher Education, Adult Education
Types:
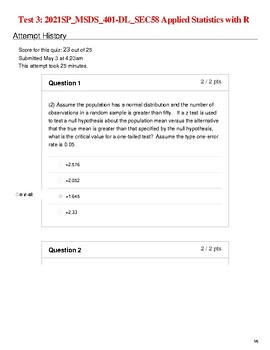
Test 3| 2021 SP_MSDS_401-DL_SEC58 Applied Statistics with R
Test 3| 2021 SP_MSDS_401-DL_SEC58 Applied Statistics with R(2) Assume the population has a normal distribution and the number of observations in a random sample is greater than fifty. If a z test is used to test a null hypothesis about the population mean versus the alternative that the true mean is greater than that specified by the null hypothesis, what is the critical value for a one-tailed test? Assume the type one-error rate is 0.05. FalseTrue(1) Answer True or FalseAssume a random sample
Subjects:
Grades:
Higher Education, Adult Education, Staff
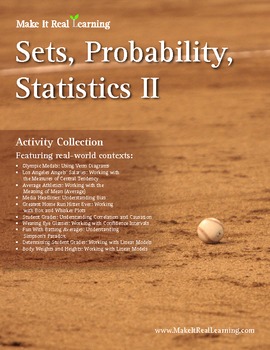
Make It Real: Sets, Probability, and Statistics 2 - Activity Collection
"When am I ever going to use this?"
It is a question that has plagued math teachers for decades. Now you can answer the question.
The Make It Real Learning Sets, Probability, Statistics II collection contains 10 real-world math activities that demonstrate everyday applications of mathematics. From Olympic Medals: Using Venn Diagrams to Fun With Batting Averages: Understanding Simpson's Paradox, the activities provide learners with valuable life skills in addition to mathematical understanding.
Subjects:
Grades:
6th - 12th, Higher Education, Adult Education
Types:
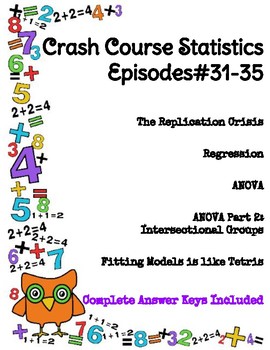
Crash Course Statistics #31-35 (ANOVA, Regression, Fitting models, Replication)
Distance Learning - #DistanceLearningEpisode Guides for Crash Course Statistics YouTube Series!Each guide comes with two versions (with and without timestamps), and a complete answer key.This product easy to use, no-prep product is a perfect last minute lesson plan, review activity, extra "filler" to keep on hand, substitute lesson plan, or homework assignment.*Great AP test prep!Plus it's only $1 per episode!-Answer key included for every episode guide-Questions are a variety of formats and var
Subjects:
Grades:
9th - 12th, Higher Education, Adult Education
Types:
Also included in: Crash Course Statistics Episodes #26-44 BUNDLE

WHO'S YOUR DADDY? Corn Genetics Unit WITH Guided Inquiry Lab
50 PAGE Mendelian Genetics Unit with a Guided Inquiry Lab using an optional Chi-Squared Statistical Test.
This can be done as a lab or can just be used as a PowerPoint presentation on Genetics and/or Meiosis.
THIS LAB IS BEST USING THE REAL EARS OF CORN BUT CAN BE DONE WITH THE PHOTOS AT THE END. CORN EARS CAN BE OBTAINED FROM BIOLOGICAL SUPPLY COMPANIES OR YOUR GARDEN. :)
This lab covers the following concepts:
1. Corn Genetics, Monohybrids and Dihybrids
2. Corn (Plant) Reproduction (Ani
Subjects:
Grades:
7th - 12th, Higher Education, Adult Education
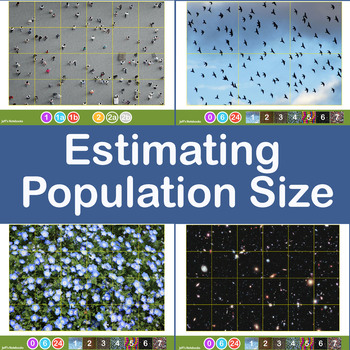
Estimating Crowd and Population Size using Jacob's Method
This investigation delves into estimating the size of a large population of objects by taking a sample and applying some basic mathematics. It encourages sharing of data, refining methods of collection of the data and discussion about the accuracy and limitations of the method used.Jacob's Method of counting large numbers of objects is simple. Draw a grid dividing the area covered into equal size squares. Estimate (by counting) the population of one grid then multiply this by the number of squar
Subjects:
Grades:
6th - 11th, Higher Education, Adult Education
Percentage Guide with 30 Printable Activities
This 152 page book is all about percentages (No shock there). It is divided into two parts: Percentage Guide and Printable Percentage Puzzles/Games/Activities.The Guide portion of the book has notes and examples of different situations involving percentages. There is a premium on using an algebraic approach to solving problems in this guide, but different methods are also used. The following are the sections of this guide:Percentage HIstoryPercentage, Fraction, & Decimal ConversionModeling P
Subjects:
Grades:
5th - 12th, Adult Education
Types:
Showing 1-24 of 183 results


