119 results
Adult education graphing resources $5-10
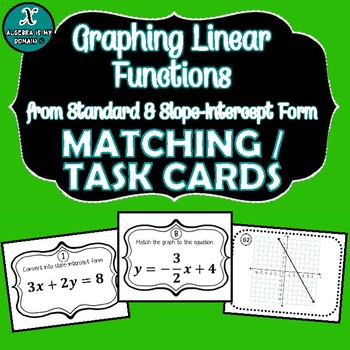
MATCHING / TASK CARDS - Standard & Slope-Intercept Form & Graphing of Lines
This file contains a set of 16 cards with linear equations in standard form, 16 cards in slope-intercept form, and 16 cards with graphs. Each card in standard form matches to one card in slope-intercept form and another card with a graph.The teacher can give use each individual set as task cards or use all three sets as matching cards.Included is an answer sheet for the students to write their answers. Teacher solution included!Great partner activity!
Subjects:
Grades:
7th - 12th, Higher Education, Adult Education, Staff
Types:
Linear Functions Interpret Rate of Change in RealWorldSituations *DISTANCE LRNG.
PRINT and DIGITAL * * Makes distance planning so much easier!Linear Functions Interpret Rate of Change in Real World SituationsLinear Functions Interpret Rate of Change in Real World Situations, has 10 different real world situations that require students to think critically about linear functions. The real world situations get more challenging as students progress through each situation. TPT buyers said, "Great resource.", "Great resource. I like particularly how they get more challenging.",
Subjects:
Grades:
7th - 11th, Adult Education
Types:
CCSS:
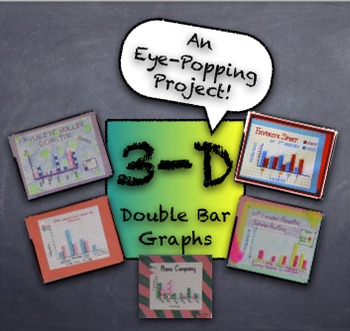
3-D Double Bar Graphs PROJECT from Student Generated Survey Data - Fun Project
This project creates quite an impressive product with simple supplies easily accessible in any classroom. Students generate data from surveys given to peers, using simple questions like, "What's your favorite pizza topping?" Students use survey results to create a 3-dimensional "girls versus boys" double-bar graph. Using centimeter graph paper, markers, and glue sticks, the double-bar graph projects are truly eye-popping! Project description, survey information, and graph assembly instructio
Subjects:
Grades:
3rd - 12th, Adult Education
Types:
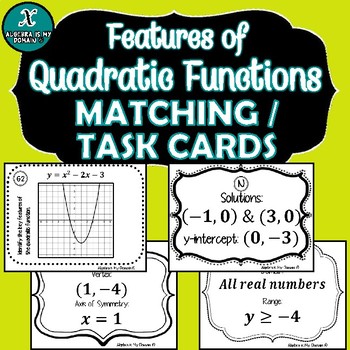
TASK CARDS / MATCHING ACTIVITY - Algebra - Parabolas & Quadratic Functions
Set of 64 total task cards / matching cards. These cards have been designed to be used to review a unit on quadratic functions.There are sixteen (16) task cards with a quadratic function and its graph. Students will then identify the vertex, axis of symmetry, the solutions (roots), y-int, domain, and range.This file includes:(16) cards with an quadratic function and graph(16) cards with the vertex and axis of symmetry(16) cards with the solutions (roots) and the y-intercept(16) cards with the
Grades:
7th - 11th, Higher Education, Adult Education
Types:
CCSS:
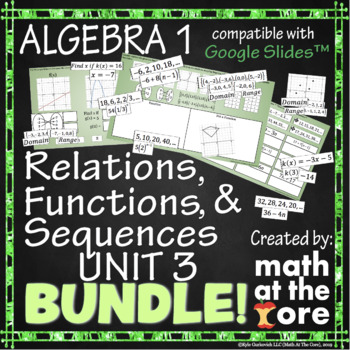
Relations, Functions, & Sequences - Unit 3 - BUNDLE for Google Slides™
- Great for online and distance learning! Created to be compatible with Google Slides™!-In this interactive unit, students will identify whether a sequence is arithmetic or geometric. They will also match the explicit formula with its appropriate sequence or both arithmetic and geometric. Students should know how explicit formulas given in multiple ways. Students will have to identify whether or not a relation is a function. Students will have to identify the domain and range of given relations.
Subjects:
Grades:
8th - 9th, Adult Education
Types:
CCSS:
Interpreting Graphs and Charts
Students work with a variety of 25 graphs and charts and learn how to interpret the information provided. The format varies from one to the other: pie, column bar, horizontal bar, line/dot, and picture (volcano) graphs and table charts. Appropriate for math, Social Studies, ELA, ESL, and Spanish culture. Can be used in Gr. 6-12, adult education, college, and home school. All answer keys provided.
Grades:
6th - 11th, Higher Education, Adult Education
Types:
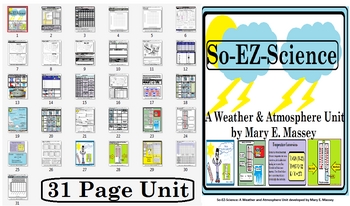
So-EZ-Science: Weather & Atmosphere Unit
This unit is a balanced literacy unit covering areas such as: temperature conversion, making a rain guage, recording weather, using weather station symbols, using the Beaufort Wind Scale, fronts, cloud types, cloud cover, graphing precipitation, graphing temperature, graphing weather phenomenon, weather tools, relative humidity, calculating relative humidity, precipitation, interpreting weather symbols on a weather map, reading a weather map, wind velocity, wind direction, wind speed, reading a
Subjects:
Grades:
3rd - 12th, Higher Education, Adult Education, Staff
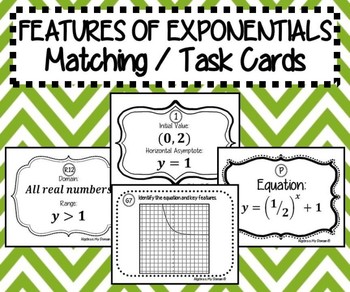
TASK CARDS / MATCHING ACTIVITY - Algebra - Features of Exponential Functions
Set of 80 total task cards / matching cards. These cards have been designed to be used to review a unit on exponential functions.
There are twenty (20) task cards with an exponential equation. Students will then match it to its graph, identify the initial value (y-int), horizontal asymptote, domain, and range.
This file includes:
(20) cards with an exponential equation
(20) cards with the graph
(20) cards with the initial value and horizontal asymptote
(20) cards with the domain and range
T
Grades:
9th - 12th, Higher Education, Adult Education
Types:
CCSS:
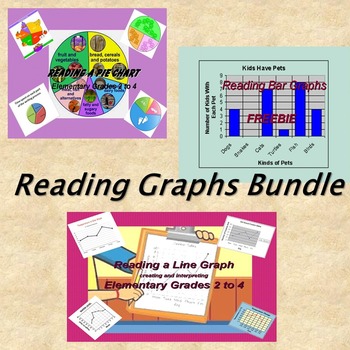
Bundled Reading Graphs
Save $2 off the individual packet price. Teach your students how to read, create, and interpret a line graph, bar graph, or pie chart from a word problem or given data. Challenge your students to think more critically and become better mathematicians. The “How to...” guide is included in this packet. Start your students on their way to becoming better problem graphic interpreters. An answer guide for each activity is provided. Some common core standards met by this activity wi
Subjects:
Grades:
2nd - 12th, Adult Education
Types:

Desmos Graphing Project (Review)
This project is meant as a review of linear functions as well as transformations in the coordinate plane (translations, reflections, rotations, dilations). Students get to choose which transformation to perform, so it does not "review all transformations". Students use Desmos to outline a letter, usually an initial, (restricting domain and range) and then transform it within Desmos (in a table). For easier projects: pick transformations for students to perform (translations, dilations) and walk
Grades:
8th - 12th, Higher Education, Adult Education
Television advertisements Slopes, regressions, lines of best fit Superbowl
Students will be asked to create two scatter plots (one for games 1-23 and a second for games 24-46). Students will then choose appropriate regression models for the growth of advertising costs. Students will choose these models based on visual representations as well as appropriate r or r2 values. Teachers can also introduce residuals here. Teachers can also help the students graph the equations as a piecewise function so that they can see the change in growth rate. Super Teachers need to
Subjects:
Grades:
7th - 12th, Higher Education, Adult Education, Staff
Types:

Math Project Linear and Exponential Functions Which Salary? *DISTANCE LEARNING
PRINT and DIGITAL * * Makes distance planning so much easier!Linear and Exponential Functions Math Project: Which Salary Would You Choose?Are you looking for a way for you students to show you they can model linear and exponential functions with a real world application? Linear and Exponential Functions Math Project: Which Salary Would You Choose?, is just what you need. TPT buyer said, "Great resource".In this project students will model salary situations involving linear and exponential func
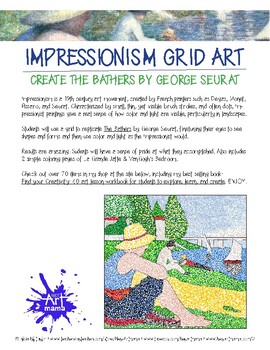
Learn about Impressionism and create artwork using pointallism and grids!
Impressionism is a 19th century art movement, created by French painters such as Degas, Monet, and Seurat. Characterized by small, thin, yet visible brush strokes, and often dots, Impressionist paintings give a real sense of how color and light play an important role in art, particularly when looking at landscapes.Students will use a grid to replicate The Bathers by George Seurat, finetuning their eyes to look at shape and form and learn to use color to create light, just as the Impressionist wo
Subjects:
Grades:
1st - 12th, Adult Education
Types:
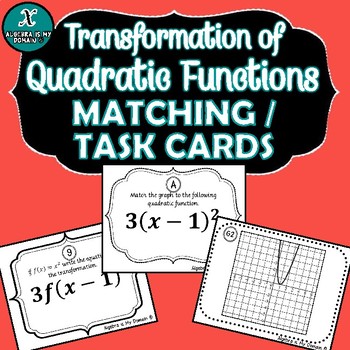
NOTES & MATCHING / TASK CARDS - Algebra - Transformations of Quadratic Functions
Set of 48 total task cards / matching cards. These cards have been designed to be used to review a unit on graphing transformations of quadratic functions and identifying the transformations.Students are given a transformation in function notation. They will determine how to rewrite the new equation, and match it to the graph. Then students will determine what transformations occurred.This file includes:* 16 cards with transformation in function notation* 16 cards with a new equation* 16 card
Grades:
7th - 12th, Higher Education, Adult Education
Types:
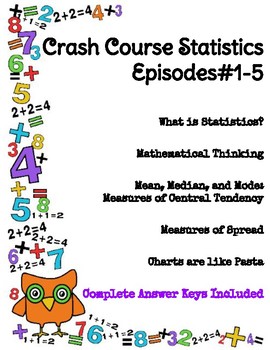
Crash Course Statistics Episodes #1-5 (Central Tendency, Charts, and Graphs)
Distance Learning - #distancelearning Online Resources - #onlineresourcesEpisode Guides for Crash Course Statistics YouTube Series!Each guide comes with two versions (with and without timestamps), and a complete answer key.This product easy to use, no-prep product is a perfect last minute lesson plan, review activity, extra "filler" to keep on hand, substitute lesson plan, or homework assignment.*Great AP test prep!Plus it's only $1 per episode!-Answer key included for every episode guide-Questi
Subjects:
Grades:
9th - 12th, Higher Education, Adult Education
Types:
Also included in: Crash Course Statistics Episodes #1-25 BUNDLE
Math Project Graphing Systems of Equations Math & Art Project *DISTANCE LEARNING
PRINT and DIGITAL * * Makes distance planning so much easier!Graphing Systems of Equations Math and Art ProjectYour students will apply their skills of graphing systems of linear equations with art! Students will graph specified types of systems of linear equations and choose how they create an original piece of art. My students love this project because it provides an opportunity for them to be creative in math class!This project is a great formative assessment because it assesses students’ s
Histograms and Frequency Tables (Powerpoint) for Busy Teachers
This powerpoint presentation introduces the concept of histograms and frequency tables.
Clipart, sounds, and animation are used sparingly and effectively to help illustrate points without being distracting. This powerpoint presentation has been extensively refined using faculty AND student input and feedback.
Definitions of histogram, interval, frequency table, and frequency are all presented. The progression from a frequency table to a completed histogram is illustrated and animated using
Subjects:
Grades:
4th - 12th, Higher Education, Adult Education
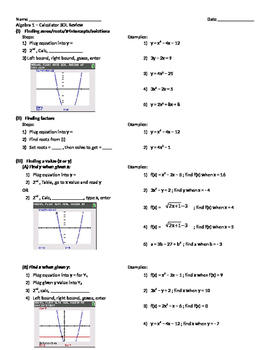
Algebra 1 Calculator Review (TI-84)
Comprehensive review of all graphing calculator concepts taught through the Algebra 1 course. Review concepts include finding roots, factors, values (x or y), y-intercept, mean, standard deviation, line/curve of best fit, and finding solutions to systems of equations. The review include steps and screenshots of the calculator.
Subjects:
Grades:
7th - 12th, Higher Education, Adult Education
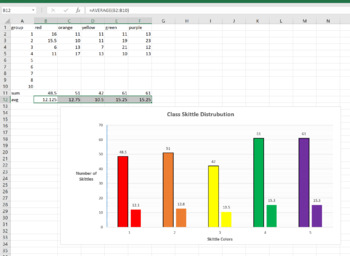
Skittle Statistics MS Excel Mini-Lab
This is a 1 class MS Excel lab for a computer or math class. You can have the students explore the distribution of different color Skittles in class. This is a great mini-lab or half-day activity when you school ends up with a weird schedule day. Tell them they can't eat till the Skittles till the end of class, or they will distort their numbers. Also make sure they don't throw them or shove them up their nose (Yes, stuck Skittles are hard to extract, ask me how I know..)The goal of this lab is
Grades:
6th - 12th, Higher Education, Adult Education
Types:
NGSS:
MS-ETS1-2
, HS-ETS1-2
, HS-ETS1-3
, MS-ETS1-4
, MS-ETS1-1
...
Also included in: Hands-on Science Semester Labs Bundle
BUNDLE: Functions and Relations Power Point with Corresponding Lab/ NO PREP
Students find the following lesson and corresponding activity to be an exhilarating mathematical experience!* Why?* They find it exhilarating, because after going through the lesson and the accompanying activity, they readily understand a simple but confusing concept. * The power point includes a 39 page power point over Functions and Relations along with a 19 page Math Lab written by yours truly. * The Math Lab provides "hands-on" experience to students where they use a pair of
Subjects:
Grades:
6th - 9th, Higher Education, Adult Education
Collaborative Review Graphing by Hand for AICE Marine / Environmental Science
If your AICE marine or AICE environmental students are learning to graph by hand, you'll want to check this out (Note, it does not include pie graphs). It is important to note this activity is actually (2) resources now, and not just one: It was recently updated, and since nothing was wrong with the original, older, resource, I left it and added to it the updated version. Make sure to see the preview!! Here's a brief overview of how each resource would go: ~~~~~~~~~~~~~~~~~~~~~~~~~~~~~☛ This Pur
Subjects:
Grades:
9th - 12th, Higher Education, Adult Education
Types:
Algebra Power-Point: The Coordinate Plane with GUIDED NOTES/DISTANCE LEARNING
I am very excited to share with you my power point on The Coordinate Plane. ^ This forty-seven page presentation brings students into a whole new realm of mathematics where algebra and geometry meet for the first time in the world of numbers. * I have included a bit of history trivia as to how the coordinate plane arrived with its name, "The Cartesian Plane," and an interesting tid-bit about it's creator. * From there, the lesson discusses the origin, x-axis, y-axis, ordered pairs
Grades:
6th - 10th, Higher Education, Adult Education
CCSS:
Also included in: BUNDLE: Algebra Power-point Graphing Linear Equations and Functions
Micro:bit Accelerometer Funcamentals
This lesson demonstrates how to use and gather information from the Micro:bit accelerometer. Use this lesson to reference lessons in science and math.The accelerometer measures motion and acceleration. Use this information to reference concepts learned in science on mass, motion, acceleration, and velocity. Use the sensor to measure motion, acceleration, and velocity.The accelerometer measures acceleration along the x, y, and z planes. Use this information to reference the coordinate plane used
Subjects:
Grades:
3rd - 12th, Higher Education, Adult Education, Staff
Types:

Practice Reading Graphs - USA Today, DISTANCE LEARNING, EASEL ACTIVITY
*** UPDATED FOR DISTANCE LEARNING *** I've done the work for you! This worksheet is ready for you to assign to your students via Google Classroom. Answer boxes are in place and ready for student input. The Answer Key has been removed in the digital activity, but you can still access it in the pdf version. This digital activity presents 10 graphs from the popular "USA Today Snapshots" to provide practice with all aspects of reading graphs - interpreting data, drawing conclusions, recognizing sou
Subjects:
Grades:
6th - 9th, Adult Education
Showing 1-24 of 119 results


