105 results
Free adult education statistics resources
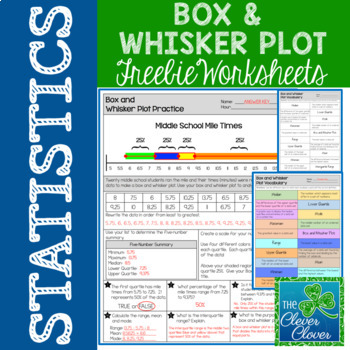
Box and Whisker Plot - FREEBIE
This resource can be used for practice with creating and interpreting box and whisker plots. Students will use twenty mile times in order to calculate the five number summary. Space is provided for students to list the numbers in order from least to greatest. Students are directed to shade and label each quartile of the box and whisker plot. After the plot has been drawn, students can answer six questions pertaining to the data.
Practice with vocabulary is also important. Students can use
Subjects:
Grades:
6th - 9th, Adult Education
Types:
Also included in: Statistics Bundle - Guided Notes, Worksheets & Scavenger Hunts!
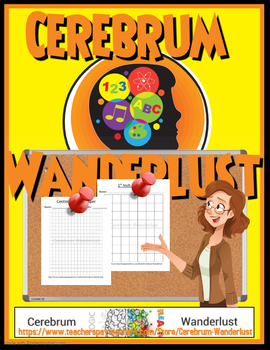
Centimeter & 1 Inch Grid Papers (Full Sheets Each)
A full sheet of Centimeter Grid Paper and a full sheet of 1 inch Grid Paper all contained in one easy to transport/store .pdf. You can use these sheets with making charts, plotting points, etc... Enjoy and thank you for your support.
Subjects:
Grades:
PreK - 12th, Higher Education, Adult Education, Staff
Types:
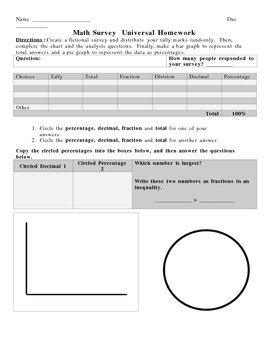
Take A Survey -- Learn Fractions, Percents and Decimals
This is a project that helps students learn to compute fractions, decimals and percents. The preview is a "universal" homework that students can complete for review any time during the year.
Take A Survey -- Learn Fractions, Percents and Decimals by Sherre Vernon is licensed under a Creative Commons Attribution-Share Alike 3.0 United States License.
Subjects:
Grades:
6th - 12th, Higher Education, Adult Education
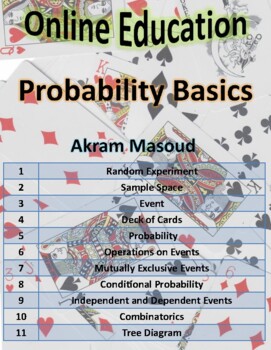
Probability Basics
This resource is a free small notebook for teaching the basics of the probabilities for high school and colleges. The resource is a PDF of nine pages and contains 11 different subjects supported by figures and solved examples. The subjects are:Random Experiment.Sample Space.Event.Deck of Cards.Probability.Operations on Events.Mutually Exclusive Events.Conditional Probability.Independent and Dependent Events.Combinatorics.Tree Diagram.If required, I am entirely ready to prepare a low price comple
Subjects:
Grades:
11th - 12th, Higher Education, Adult Education, Staff
Types:
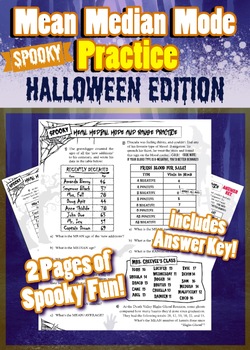
Halloween Mean Median Mode Range Practice - Spooky and Fun Math Handout
Spooky and FUN Mean Median Mode Range Practice - Halloween Printable ActivityEven your most ghoulish students will love this handout! It's full of hilarious scenarios and monster names, and includes lots of spooky fonts and icons. Your students will be so entertained by this printable, that they'll forget they're improving their math skills while using it.Since each problem on the handout is a multi-part problem, this handout features over 25 chances for students to improve their statistical ana
Subjects:
Grades:
4th - 9th, Adult Education
Types:
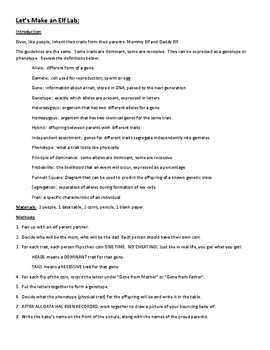
Mendel Genetics "Let's Make an Elf" activity
Use Mendel's Laws of Inheritance to make a unique Christmas Elf! You will receive a pdf with instructions for teams of two students to flip a coin to pick which allele (dominant or recessive) for 20 different traits will be inherited by the baby elf! Vocab words and definitions are included. Data table for filling out results of coin tosses, and a lab part 2 for more advanced learners.
Grades:
6th - 12th, Higher Education, Adult Education
Types:
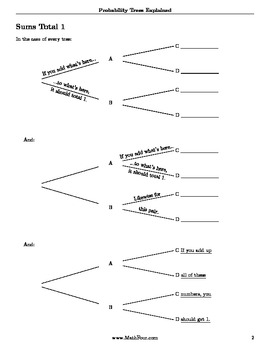
Probability Trees Explained
Using probability tree diagrams to teach probability is helpful - but sometimes kids (and grownups) need a little help with them.
This "cheat sheet" has 5 pages of detailed (and easy to understand) explanations on how to calculate the various probabilities - including conditional probabilities.
Once students understand how probability trees work, they can effectively use them as tools.
Make sure you also download my Probability Trees Puzzles free worksheet, too!
And for more information, se
Subjects:
Grades:
9th - 12th, Adult Education
Types:

Creating Histograms, Box Plots, & Dot Plots - Lesson Plan with Activities!
*** This file is FREE because educators never get paid enough. If you find this file helpful, please consider donating no more than $1.00 via Zelle or PayPal (as Friend/Family) to InfiniteInsightHub@gmail.com. ***Teacher-created lessons and activities on creating & analyzing Histograms, Box Plots, & Dot Plots!
Subjects:
Grades:
7th - 12th, Higher Education, Adult Education, Staff
Types:
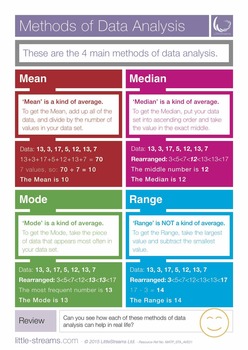
Methods of Data Analysis | Poster on Mean, Median, Mode and Range
This is a simple and completely FREE poster on the four common methods of data analysis. It states simply how to find each.
You may also like:
Mean, Median and Mode Bingo
Averages Follow Me Cards
Mean Wars Averages Card Game
If you have any comments or suggestions, and to stay updated please follow us or take a look at our Facebook Page
Please click here to visit our website for more information about LittleStreams
Subjects:
Grades:
5th - 8th, Adult Education
Types:
CCSS:
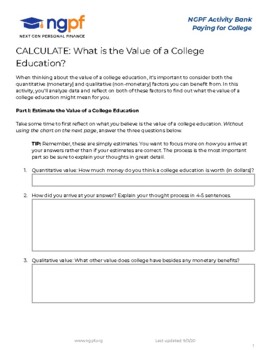
CALCULATE: What is The Value of A College Education?
Using research from the US Bureau of Labor Statistics, students will calculate the value of a college education. First, they will estimate its value. Then, they use a chart from the Dept. of Labor to calculate the value (in career earnings) of different levels of education. Finally they will reflect on that value. NGPF Activities teach your students key personal finance concepts while also honing their analytical skills.
Grades:
7th - 12th, Higher Education, Adult Education
Types:

Project-Based Learning | High School Math (Statistics) | Data Collection, Graphs
Chugging Along or Running Late? A Project-Based Learning Bonanza for Aspiring Statisticians and Transportation Engineers!Are you an educator, homeschool parent, or student looking for an engaging Project-Based Learning (PBL) experience that goes beyond theory and tackles a real-world challenge in the transportation industry? Look no further than Scienovate's Chugging Along or Running Late? Analyzing Delays in Commuter Rail Systems project!A Winning Project for Every Learner:This meticulously des
Subjects:
Grades:
9th - 12th, Higher Education, Adult Education
Also included in: Project-Based Learning, PBL | High School Math (Statistics)
Project-Based Learning | High School Math (AP Statistics), AP Statistics Project
Green vs. Concrete: Equipping Future Leaders with AP Statistics for Sustainable DesignThe construction industry faces a critical challenge: balancing the growing need for housing with the importance of preserving green spaces. This is where Scienovate's innovative Green vs. Concrete: Can Statistics Help Us Achieve Sustainable Neighborhood Design? Project-Based Learning Project (PBL) comes in.A Project-Based Learning Powerhouse:This meticulously crafted AP Statistics project transcends the realm
Subjects:
Grades:
9th - 12th, Higher Education, Adult Education
Also included in: Project-Based Learning, PBL | High School Math (AP Statistics)

Comprehensive Statistics Worksheet Collection - 8 Units - 34 Worksheets
Enhance your statistics curriculum with this extensive collection of 34 worksheets spanning 8 units. Whether you're a math teacher looking for additional resources or a homeschooling parent seeking comprehensive materials, this worksheet collection provides a wealth of content to support students' understanding of statistics.Unit 1: Introduction to StatisticsWorksheets: 4Description: Introduce students to the fundamentals of statistics, including descriptive vs. inferential statistics, types of
Subjects:
Grades:
9th - 12th, Higher Education, Adult Education
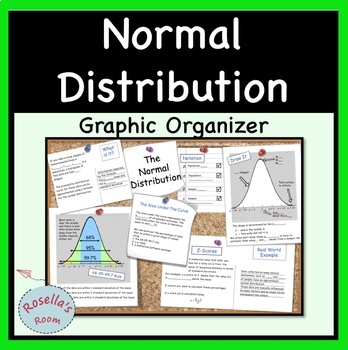
Normal Distribution Graphic Organizer
This graphic organizer summarizes:- properties of the normal distribution- the 68-95-99.7 rule- z-scoresIncluded are three scaffolded versions of the same graphic organizer; two are designed for students to fill in (one is left blank and the other has missing text) and the third is complete with all text. Great for revision.
Subjects:
Grades:
9th - 12th, Higher Education, Adult Education
Mean, Variance, and Standard Deviation Using Halloween Candy! FREE
This product is an example of how to find the mean, variance, and standard deviation using Halloween candy. This allows students to visual the math using an easier concept to grasp instead of just numbers (Halloween candy).You can even bring in your own Halloween candy to really make this lesson SWEET! :)*****************************************************************************Terms of use:This item is a paid digital download. As such, it is for use in one classroom (or by one teacher) only.
Subjects:
Grades:
9th - 12th, Higher Education, Adult Education
Types:
The Basics of Data Analysis
This teacher guide will assist the teacher and your students with the basics of plots and graphs related to data analysis. Measures of center will also be discussed. Everywhere one looks we see numbers and data. From our height and weight measurements at the doctor’s office to weighing bananas at the produce department scale, we are constantly bombarded with numbers. Trying to find a meaning from this information can become a monumental task. A branch of mathematics called “statistics” tries
Grades:
4th - 12th, Higher Education, Adult Education
Types:
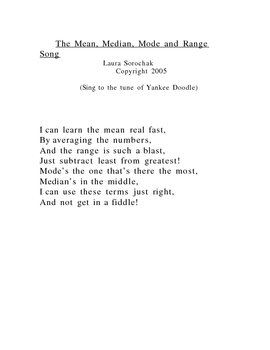
The Mean, Median, Mode and Range Song
This is an easy song to learn-my fifth-graders have memorized it in five minutes. For years, this song has helped my students and thousands of others, to keep these confusing terms straight. ANYONE can sing this easy song. It will stay in long-term memory-you'll hear from your students years from now as they call on this song in their freshman STATS 101 class!
The Mean, median, mode and range song by Laura Sorochak is licensed under a Creative Commons Attribution-Noncommercial-No Derivative Wor
Subjects:
Grades:
4th - 12th, Higher Education, Adult Education
Types:
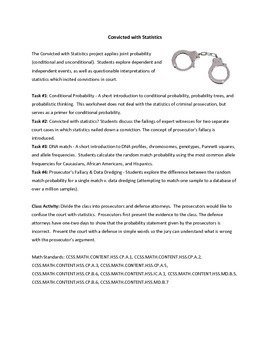
Convicted with Statistics
The Convicted with Statistics project applies joint probability (conditional and unconditional). Students explore dependent and independent events, as well as questionable interpretations of statistics which could incite convictions in court. Students discuss the failings of expert witnesses for two separate court cases in which statistics nailed down a conviction. The concept of prosecutor's fallacy is introduced. A short introduction to DNA profiles, chromosomes, genotypes, Punnett squares, a
Subjects:
Grades:
9th - 12th, Higher Education, Adult Education
Types:
CCSS:
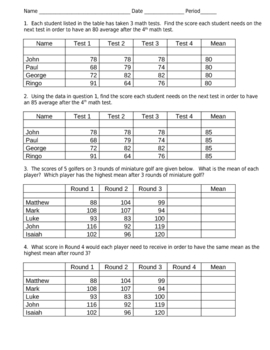
Measures of Central Tendencies - Find the Missing Mean problems
Looking for some problems to help teach students to find the missing mean?
Subjects:
Grades:
5th - 10th, Higher Education, Adult Education
Types:
Market Research Project
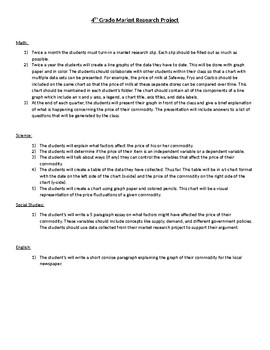
This is a great project I am currently working on with my 4th grade students. We signed up to research various products that are commonly bought at the supermarket. Some of the items we are researching include spinach, milk, wheat bread, turkey, cheese, and peanut butter. Every other week we collect data by shopping or calling the store. We record the date the information is collected, the quantity of the product (ounces or fluid ounces), and the price of the product. We use this information to
Subjects:
Grades:
4th - 9th, Adult Education

Error management
Way to handle approximate values not to make rude mistakes.
Subjects:
Grades:
Higher Education, Adult Education, Staff
Statistical Inference: which tests to perform
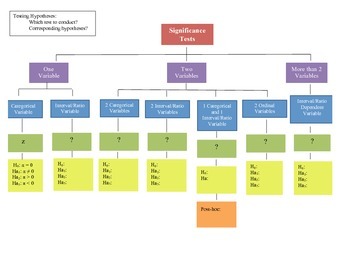
The statistical inference chart provides a visual for choosing the appropriate statistical test to perform and the associated hypotheses based on the number and type of variables.
The assignment page can be used as an in-class or home work assignment with accompanying answer key. The answer key itself can serve as an in-class handout or classroom poster. The answer key serves as an outline for the basics of inferential statistics.
I give this to my MA and PhD social science students in their i
Grades:
11th - 12th, Higher Education, Adult Education
Types:
Probability of Dependent and Independent Events
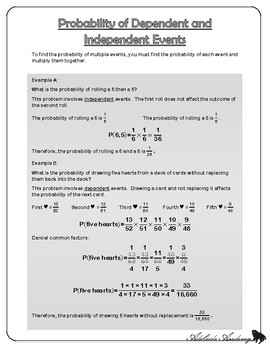
Worksheet with an example.
Subjects:
Grades:
9th - 12th, Adult Education
Types:
Line of Best Fit Example/Notes
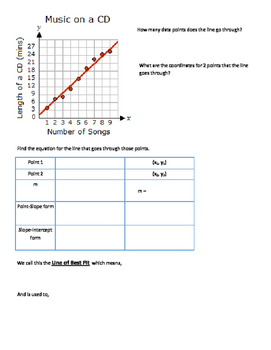
Using students prior knowledge of linear functions, this example helps them recall and walk through an example to find the linear equation for the line of best fit.
Subjects:
Grades:
6th - 10th, Adult Education
Showing 1-24 of 105 results


