30 results
Statistics unit plans for Microsoft PowerPoint
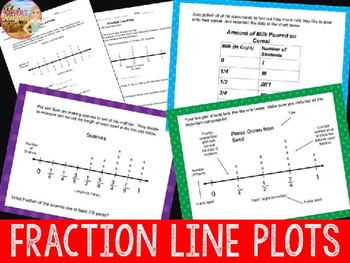
Fraction Line Plots Unit
Fraction Line Plots are easy to teach with this unit. Students will interpret line plots with addition and subtraction with these slides and accompanying worksheets.Students will evaluate ready-made fraction line plot data as well as learn how to make their own graphs from a given set of fraction data.Materials Included- Data Analysis Vocabulary Slide- 7 Interpreting Data Graphs (35 slides)- 3 Charts for Creating Graphs (10 slides)- 9 Student Sheets- Post-Test- Answer KeyNo-Prep SetupFor each se
Subjects:
Grades:
5th - 6th
CCSS:
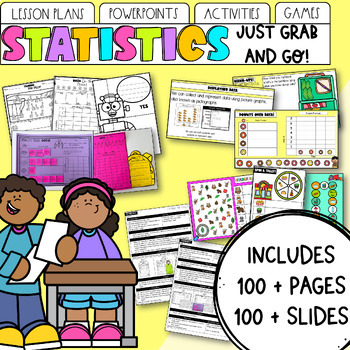
Statistics & Data | Maths Unit: Lessons, PowerPoint, Activities & Games
Looking for statistics and graphing planning that ticks all your boxes? Look no further! Teaching is hard enough, without spending hours creating differentiated lesson plans and activities. Not to mention the time spent planning what your early finishers can do, what assessment points to consider, or sourcing games that consolidate previous skills! With this Statistics and Data Unit, everything is done for you. Want to buy in early to the discounted bundle and get all updates for free? Find my G
Subjects:
Grades:
K - 2nd

Grade 9 Geography STRAND D: Changing Populations Unit Bundle
This STRAND D: Changing Populations Bundle is a perfect fourth unit for Grade 9 Canadian Geography and includes over 100 slides of content, one quiz, and two bonus assessment activities! The bundle includes 6 products total. Answer keys are include for all quizzes and assessments. Content includes: Population trends in Canada, Immigration Trends in Canada, and Population Characteristics!! Bonus content includes 12 Kahoot Links to use as a study tool. Play as a class or students can challenge the
Subjects:
Grades:
7th - 10th
Statistics Unit 5 Bundle - Probability Curriculum (15 days)
This is a unit plan bundle for a Statistics class. The plans include common core math standards, time frame, activities, enduring understandings, essential questions, and resources used. It is designed to last 15 days, depending on pacing. The plans include: 56-slide presentation, with annotated guide for reference7 Worksheets"Do Now" Entrance problems4 quizzesLaw of Large Numbers Activity Worksheet (Drawing Hearts)Review slides (for student-group presentations, review handout included)Unit test
Subjects:
Grades:
9th - 12th, Higher Education
CCSS:

Algebra 1 Curriculum - Semester 2 EDITABLE Unit Plans | Bundled for Common Core
This is a great bundle that covers concepts for the second semester of an Algebra 1 course!Included:- Pacing guides with common core state standards (18-week guide) (PDF and Word)- Overview of the common core alignment (PDF)- Guided notes for 39 lessons (PDF and Word)- PowerPoint presentations (aligned with guided notes) (PPTX)-5 Mid-unit quizzes (PDF and Word)-5 Unit tests (PDF and Word)-Semester exam (PDF and Word)Each lesson contains a learning scale, warm up (do-now or bell ringer), key conc
Subjects:
Grades:
8th - 12th
CCSS:
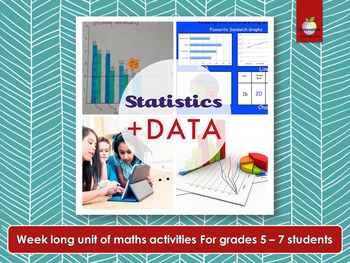
Statistics & Data Math Unit | Project Based Learning | Mean, Median, Mode, Range
Make math relevant and engaging for your students with the elementary/primary STATISTICS and DATA PROJECT. This NO PREP, this hands-on PROJECT-BASED LEARNING, will keep your class busy learning about MEAN, MEDIAN, MODE and RANGE for a whole week.COVERINGHow to ask and survey an “essential question.”Data collection methodsDrawing mathematical conclusions from dataPresenting data in graphs and tablesPresenting data and conclusions to peersThis insightful project makes a great, lively introduction
Subjects:
Grades:
5th - 7th
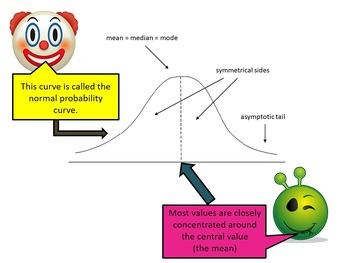
Distributions using Normal Curve - Z score table Statistics Grade 11/12
This Resource is a Statistics Powerpoint on Distributions.The normal bell curved will be investigated along with the Standard Deviation. Z Score tables will be looked at and how to use Z score tables for any type of distribution.Examples, questions and answers have also been provided.Kind RegardsENTER-ONE
Subjects:
Grades:
10th - 12th

Data Representation Powerpoint
The presentation contains: 1) TALLY MARKS Learning Objectives. Definition of a tally mark. Uses of tally mark. How to count a tally mark. Tally Mark Chart. Construction of a tally mark table with an example. Application on real life problems on tally mark. Read and Interpret a tally mark table.The presentation contains: 2) FREQUENCY DISTRIBUTION TABLEDefinition of a Frequency Distribution Table. Types of Frequency Distribution Table: a) Discrete Frequency Distribution Table (Ungrouped).b) C
Subjects:
Grades:
1st - 10th, Higher Education, Staff

Pie Chart Powerpoint
The presentation contains:Learning Objectives.Definition of a Pie Chart.Tips for construction of pie chart.Steps to construct a pie chart with an example.Scaling and drawing a pie chart.Read and Interpret a pie chart.
Subjects:
Grades:
5th - 10th, Staff
Also included in: Data Representation Powerpoint
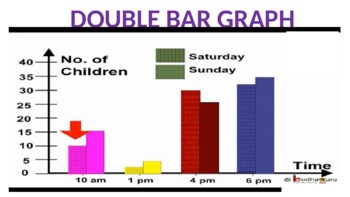
Double Bar Graph Powerpoint
The presentation contains:Learning Objectives.Definition of a double bar graph.Parts of a double bar graph.Difference between bar graph and double bar graph.Tips for construction of double bar graph.Steps to construct double bar graph with an example.To read and interpret the double bar graph.
Subjects:
Grades:
5th - 10th, Staff
Also included in: Data Representation Powerpoint
Line Graph Powerpoint
The presentation contains:Learning objectives.Definition of a line graph.Parts of a line graph.Tips for construction of line graph.Steps to construct line graph with an example.Reading and Interpreting a line graph.Advantage of line graph.
Subjects:
Grades:
5th - 10th, Staff
Also included in: Data Representation Powerpoint

Statistics for the Social Sciences - Chapter 3.1 Tabular Methods
This lesson will provide definitions of the following statistical concepts:
1. Frequency distribution
2. Cumulative frequency distribution
3. Cumulative percentage distribution
4. Proportions and Percents
Subjects:
Grades:
Higher Education

Social Science Statistics: Chapter 2 Variables
This video will provide answers to the following questions:
1. What are variables?
2. How do variables, attributes, and codes differ?
3. What are the four levels of measurement scales: nominal, ordinal, interval, and ratio?
4. Why do statisticians need to know the level of measurement for their variables??
Subjects:
Grades:
Higher Education
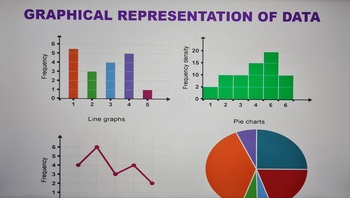
Graphical Representation of Data Powerpoint
The presentation contains the follows:1) BAR GRAPH Learning objectives. Definition of a bar graph. Parts of a bar graph. Tips for construction of bar graph. Steps to construct bar graph with an example. Types of bar graph. Advantages of bar graph. 2) DOUBLE BAR GRAPH Learning Objectives. Definition of a double bar graph. Parts of a double bar graph. Difference between bar graph and double bar graph. Tips for construction of double bar graph. Steps to construct double bar graph wit
Subjects:
Grades:
5th - 9th, Staff
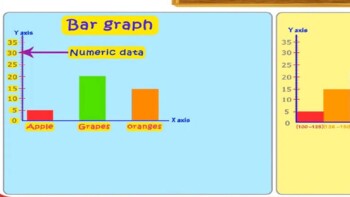
Bar Graph Powerpoint
The presentation contains:Learning objectives.Definition of a bar graph.Parts of a bar graph.Tips for construction of bar graph.Steps to construct bar graph with an example.Types of bar graph.Advantages of bar graph.
Subjects:
Grades:
6th - 9th, Higher Education, Staff
Also included in: Data Representation Powerpoint

Tally Marks Powerpoint
The presentation contains:Learning Objectives.Definition of a tally mark.Uses of tally mark.How to count a tally mark.Tally Mark Chart.Construction of a tally mark table with an example.Application on real life problems on tally mark.Read and Interpret a tally mark table.
Subjects:
Grades:
4th - 7th, Staff
Also included in: Data Representation Powerpoint
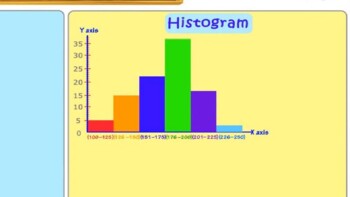
Histogram Powerpoint
The presentation contains:Learning Objectives.Definition of a Histogram.Parts of a histogram.Difference Between bar graph and histogram.Types of intervals.Tips for construction of bar graph.Steps to construct bar graph with an example.Read and Interpret a histogram.
Subjects:
Grades:
7th - 11th, Staff
Also included in: Data Representation Powerpoint
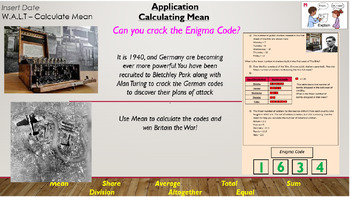
Calculating Mean - Full 2 Lesson Bundle Pack! Year 6, 7, 8 - Grade 5, 6, 7
Full Multiple Lesson Bundle PackCalculating Mean - 2 Lesson Bundle Pack! - UKS2 / LKS3 - 4th, 5th and 6th Grade**TeksTeaching04 - Calculating Mean 2 Lesson Bundle**Within this bundle is Two Maths lessons focusing on Calculating MeanThese lessons have been designed for a Year 6 classroom in the UK, but can easily be applied to a Year 7 or year 8 classroom, as well as being suitable for grades 5, 6 and 7 in the US.Lessons are structured in the following way;Starter / Do Now / Introductory TaskInpu
Subjects:
Grades:
5th - 7th
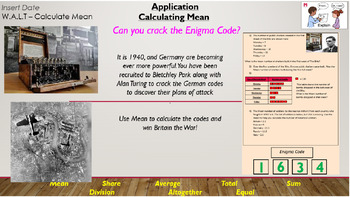
Calculating Mean - Full Lesson 1 Bundle - WW2 Enigma Link - Y6,7,8 - Grade 5,6,7
Single Lesson Bundle PackFull Calculating Mean Lesson 1 Bundle!Calculating Mean Lesson Bundle - UKS2 / LKS3 - 5th, 6th and 7th GradePart 1 of the **TeksTeaching04 - Calculating Mean 2 Lesson Bundle Pack**Within this bundle lesson pack is a full Calculating Mean Lesson.These lessons have been designed for a Year 6 classroom in the UK, but can easily be applied to a Year 6 or year 8 classroom, as well as being suitable for grades 5, 6 and 7 in the US.Lessons are structured in the following way;Sta
Subjects:
Grades:
5th - 7th
Probability Unit (Powerpoint)
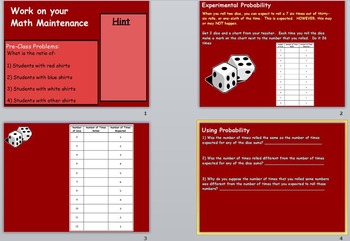
This is a compressed file that includes all the necessary sections for a full unit on PROBABILITY. The unit typically requires 1.5 to 2 weeks to complete. The file contains powerpoints regarding:Unit Vocabulary - worksheetVocabulary Review - worksheetLesson 1 - Probability Experiment (dice) ppt/worksheetLesson 2 - Ratios (children in a school yard) ppt/worksheetLesson 4 - Probability of a Board Game pptLesson 7a - Ratios and Probability with Playing Cards pptLesson 7b - Ratios and Probability wi
Grades:
6th - 8th

Data Handling Powerpoint
The presentation contains:Statistics.Fundamental Characteristics of Data.Raw data.Types of Data.Data Handling Cycle.Data Tabulation/ Recording of data .Array with example.Organisation of data.Types of statistical data.Tables e.g. Tally chart / Frequency Distribution Table.Pictures e.g. Pictogram.Graphs e.g. Bar graph, Pie chart, Line graph,Diagrams e.g. Tree diagram, Venn diagram, Mapping or Arrow diagram.Using ICT in data handling.
Subjects:
Grades:
5th - 10th, Staff
Also included in: Data Representation Powerpoint

Mean, Median, Mode and Range Powerpoint
The presentation contains:Central Tendency.Importance of Central Tendency.Types of measures of central tendency.Mean and its examples.Range and its examples.Median and its examples.Mode and its examples.
Subjects:
Grades:
5th - 10th, Staff
Also included in: Data Representation Powerpoint
Frequency Distribution Table Powerpoint
Objective: The student will be able to organize the given data to a meaningful and understandable.The presentation contains:Definition of a Frequency Distribution Table. Types of Frequency Distribution Table: a) Discrete Frequency Distribution Table (Ungrouped).b) Continuous Frequency Distribution Table (Grouped). Uses of Frequency Distribution Data.5 steps to construct a Frequency Distribution Table with one example on ungrouped data and two examples on grouped data.Steps include how to
Subjects:
Grades:
5th - 8th, Staff
Also included in: Data Representation Powerpoint
Pictograph Powerpoint
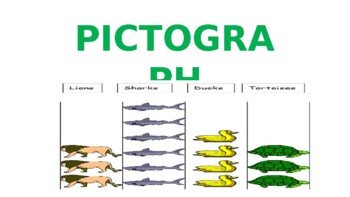
The presentation contains:Learning Objectives.Definition of a Pictograph.Parts of a pictograph.Tips for construction of pictograph.Steps to construct pictograph with an example.Scaling and drawing a pictograph.Read and Interpret a pictograph.
Subjects:
Grades:
1st - 7th, Staff
Also included in: Data Representation Powerpoint
Showing 1-24 of 30 results


