11 results
Statistics study guides for Microsoft PowerPoint
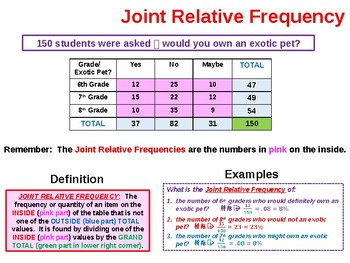
Two Way Frequency Tables Summary
This MS PowerPoint presentation provides background information on 2-Way Frequency Tables as well as the specific steps to follow create and analyze them. It is used to kickoff our study of this subject n my Pre-Algebra and Math I classes. It addresses all of the terms encountered in the construction and use of 2-Way tables including Joint Relative Frequency, Marginal Relative Frequency and Conditional Relative Frequency. It is a totally animated ppt file and very easy for students to underst
Subjects:
Grades:
8th - 10th
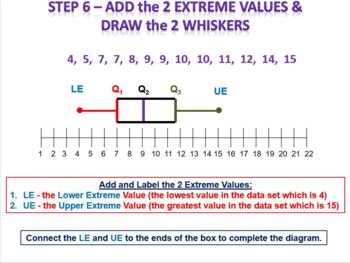
Math 1 / Algebra 1 Bundle - Unit 9 Statistical Measures and Data Analysis
This bundle includes various instructional MS PowerPoint (PPT) slidepacks that I initially use when covering the Math 1/Algebra 1 content area titled: Unit 9 - Statistical Measures and Data Analysis. The following slidepacks are included in this bundle:Box and Whisker Plot Analysis and Construction including Outliers General Statistics - Mean, Median, Mode, Range and Mean Absolute Deviation Mean, Median, Mode, Range and Standard Deviation SummaryScatterplots and Correlation SummaryTwo Way Frequ
Subjects:
Grades:
9th - 12th
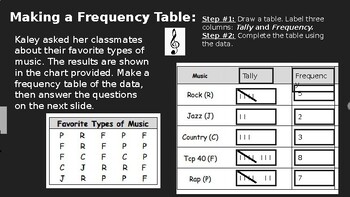
Frequency Tables and Histograms Assignment/Practice Questions
This is a PowerPoint that can be used as practice problems (classwork or homework) to help understand data through frequency tables and histograms. These notes align with the EnVisions Math textbook for topic 8, lesson 4 but can be used separately as well! (Delete the yellow "answer key" clip art along with any answers on each slide before assigning students their copy!) Document can be downloaded and edited as needed.
Subjects:
Grades:
5th - 8th
Types:
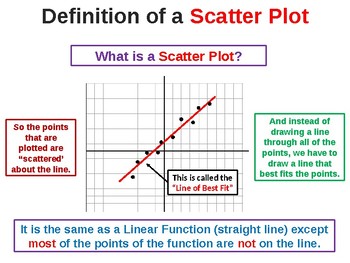
Scatterplots and Correlation Summary
This MS PowerPoint presentation covers the specifics of both Scatterplots and Correlation. It is used to kickoff our study of these topics in my Pre-Algebra and Math I classes. It covers the detailed steps to follow to analyze a data set and construct a Scatterplot and Line of Best Fit as well as determine the Correlation of the data. It covers the steps to use with to determine these measures without a graphing calculator. It is a totally animated ppt file and very easy for students to unde
Subjects:
Grades:
8th - 10th
CCSS:
Statistical Inference Jeopardy Review
This can be used in a Stats Class for the Inference Unit, or in a Common Core Algebra 2 Class for the Stats Inference Unit for a good review. There are five categories; Simulations, Margin of Error, Confidence Intervals, Significance Tests, and Anything Goes.
Subjects:
Grades:
10th - 12th
Math Topics: Mean, Median, and Mode
This is a follow-up to my Math Topics Part 1 product.
By purchasing Math Topics: Mean, Median, and Mode you will receive a 10 slide powerpoint presentation that can be used as a primary or supplemental teaching resource. This resource is packed with visuals, step by step guided examples, and concludes with opportunities for student practice to check for understanding and to check their answers. It can be printed to be used as a practice study guide for students as well.
Subjects:
Grades:
5th - 12th, Adult Education
CCSS:
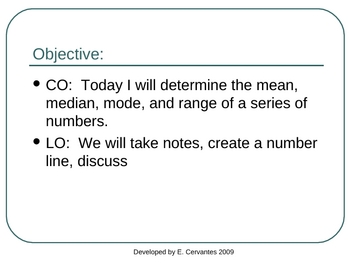
Mean, median, mode, range, cluster, gap powerpoint
A PowerPoint presentation for mean, median, mode, range, cluster, gap by Eva Cervantes
Subjects:
Grades:
5th - 6th
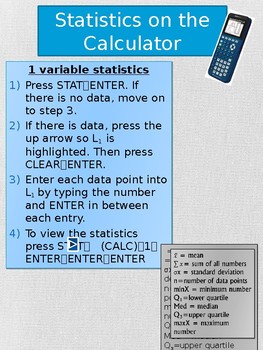
Statistics on the Calculator
The document is a guided notes to finding the line of best fit, scatter plots, 1 variable statistics, mean, median, mode, dot plots and histograms on the calculator. I laminate it and keep it in my supports folder on each table in my classroom.
Enjoy! After downloading, please rate me and give feedback! Follow me if you would like to see more.
Subjects:
Grades:
7th - 11th
AMAZING 6th Grade EngageNY/Eureka Math End of Module 6 Assessment Review
6th Grade EngageNY/Eureka Math End of Module 6 Assessment Review: composed of 20 previous released STAAR questions that apply to this unit.
Subjects:
Grades:
6th
annotated: HPC: CU 2A: 2.1 Day 1: Linear and Quadratic Functions and Modeling
- Identifying Polynomial Functions and their degrees
- write a LINEAR equation given two ordered pairs
- average rate of change
- vertex from of a quadratic equation
- Matching quadratic equation to their graphs
- Graphing a quadratic function in vertex form
Subjects:
Grades:
10th - 12th

Tips for Writing an Effective Questionnaire/Survey
This is a presentation we used for our Year 6 exhibition to assist them with writing questionnaires. It can easily be used for Upper Elementary or Middle School. It is a PowerPoint that can be edited. I reduced the text size so it could be uploaded to the free section of this website.
Grades:
5th - 8th
Types:
Showing 1-11 of 11 results


