16 results
3rd grade graphing lectures
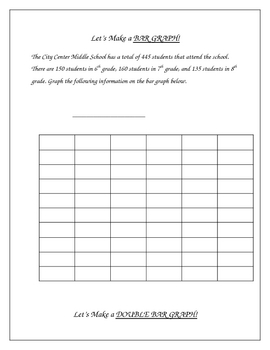
Constructing Graphs - Bar Graphs, Line Graphs, Circle Graphs
**I revised the numbers in the pie graph on this from the first version, these amounts are much more friendly** This activity includes construction of a bar graph, double bar graph, line graph, double line graph, and a circle graph.I put this together after being frustrated about not being able to find any graphing activities appropriate for intermediate grades that would allow me to make graphs with the class on my smartboard. I needed some examples to demonstrate how to take data and create a
Subjects:
Grades:
3rd - 10th, Adult Education
Types:
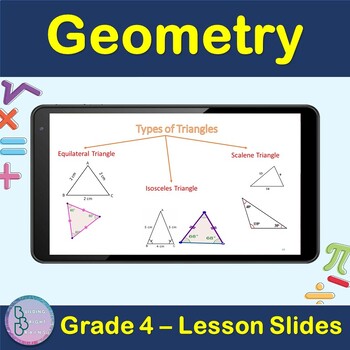
Geometry | 4th Grade PowerPoint Lesson Slides Line Circle polygon Triangle
Are you teaching your students about Geometry For 4th Grade? Plenty of examples and application exercises are included. You can also easily convert this to a Google Slides lesson by dragging it into your Google Drive.What is included?✦ 49 total slides for notes, examples and applications.✦ All steps are animated to allow the teacher to explain them gradually. At the end of the lesson, students will be able to Apply✦ Point, Line, Line segment✦ Angles, Parallel and perpendicular lines✦ Circles✦ po
Grades:
3rd - 5th
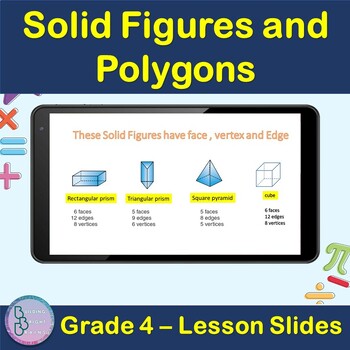
Solid Figures and Polygons | 4th Grade PowerPoint Lesson Slides
Are you teaching your students about Solid Figures and Polygons For 4th Grade? Plenty of examples and application exercises are included. You can also easily convert this to a Google Slides lesson by dragging it into your Google Drive.What is included?✦ 11 total slides for notes, examples and applications.✦ All steps are animated to allow the teacher to explain them gradually. At the end of the lesson, students will be able to ✦ Define Polygons✦ Define Solid figures✦ Understand Solid figures Fac
Grades:
3rd - 5th
Data Representation Powerpoint
The presentation contains: 1) TALLY MARKS Learning Objectives. Definition of a tally mark. Uses of tally mark. How to count a tally mark. Tally Mark Chart. Construction of a tally mark table with an example. Application on real life problems on tally mark. Read and Interpret a tally mark table.The presentation contains: 2) FREQUENCY DISTRIBUTION TABLEDefinition of a Frequency Distribution Table. Types of Frequency Distribution Table: a) Discrete Frequency Distribution Table (Ungrouped).b) C
Subjects:
Grades:
1st - 10th, Higher Education, Staff
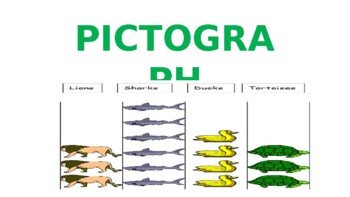
Pictograph Powerpoint
The presentation contains:Learning Objectives.Definition of a Pictograph.Parts of a pictograph.Tips for construction of pictograph.Steps to construct pictograph with an example.Scaling and drawing a pictograph.Read and Interpret a pictograph.
Subjects:
Grades:
1st - 7th, Staff
Also included in: Data Representation Powerpoint
Lines, points and Planes
This is a 15 slides Power Point presentation that covers Points, Lines and Planes. It contains the definitions of points, lines and planes with good examples.
My Quizzes:
4th Grade Word Problems Quiz (10 Q)
Equations and Inequalities Quiz (20 Questions)
An Introduction to Functions Quiz (11 Questions)
Evaluate Expressions Quiz (22 questions)
Pairs of Lines Quiz (17Q)
Types of Angles Quiz (10 Q)
Increasing Growth Pattern Quiz (10 Q)
Compare and Order Decimals Quiz (10 Q)
Ratio Q

Creating Bar Graphs
This is a math lesson on learning to create bar graphs. It is geared for 3rd graders and meets the Georgia Performance (GPS) standards for math. This lesson has 7 slides and includes an essential question, an internet link, and a summarizing activity. It is designed to be an introduction to this topic and provide guided practice.
Subjects:
Grades:
2nd - 4th
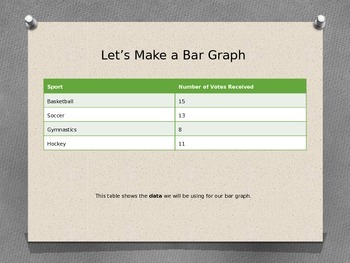
Creating a Bar Graph
Engaging PowerPoint to teach students what a bar graph is used for and how to create a bar graph.
Includes: data, labels (axis, title, scale), opportunity for student participation during whole class instruction
I personally used this to teach students how to graph rainfall in the Amazon Rainforest during a social studies unit on Brazil. Great for a minilesson across curriculum areas!
Note: margins and location of slide information is aligned properly when viewed in presentation mode
Subjects:
Grades:
3rd - 5th

Collecting Data Smartboard Lesson
This is a math lesson on tally tables, frequency tables, and collecting data. It is geared for 3rd graders and meets the Georgia Performance (GPS) standards for math. This lesson has 9 slides and includes an essential question and a summarizing activity. It is designed to be an introduction to this topic and provide guided practice.
Subjects:
Grades:
1st - 3rd

Using Data
This is a math lesson on interpreting results (data) from a survey. It is geared for 3rd graders and meets the Georgia Performance (GPS) standards for math. This lesson has 8 slides and includes an essential question and a summarizing activity. It is designed to be an introduction to this topic and provide guided practice.
Subjects:
Grades:
1st - 3rd

Using and Creating Grids
This is a math lesson on creating and using grids and ordered pairs. It is geared for 3rd graders. This lesson has 7 slides and includes an essential question lots of practice for students. It is designed to be an introduction to this topic and provide guided practice.
Subjects:
Grades:
1st - 4th
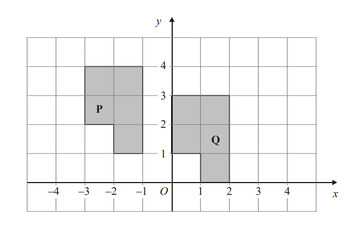
Midpoint of a Line, Translation and Reflection of 2D Shapes. PPT File
This is a power point presentation that covers the topic midpoint of a line segment, the coordinate of a point that lies a fraction of a line segment. Translation of 2D shapes with examples that cover performing the translation and describing the translation.Reflection of 2D shapes with examples that cover performing the reflection and describing the reflection.
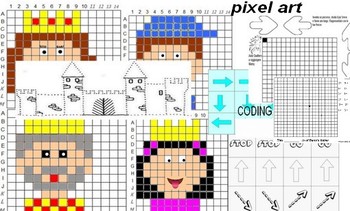
PRINCESS, LAB, 10 PAGES. CODING, PIXEL ART, MYSTERY FIGURE
PRINCESS LABTHE LABORATORY INCLUDES- 4 MYSTERY FIGURE (NAVAL BATTLE SHEETS)-1 MYSTERY FIGURE (ARROWS ROUTE)-1 ARROWS ROUTE HORSES-CASTLE-2 SHEETS ARROWS WITH EXPLANATIONS
Subjects:
Grades:
K - 4th
Types:
How to Make a Graph
Each PowerPoint slide shows steps on how to make a Pictograph (Picture graph), a Bar Graph, and then a Line Plot.
Grades:
2nd - 5th
Pictograph Examples - Thanksgiving Edition
Here are some real-world examples of data pertaining to the Thanksgiving holidays with some nicely drawn illustrations.These examples will help students easily understand data, why it is important, and how to use it in real-world situations.Package Includes:-1 Pictograph of: Turkeys Bought Last Year from the Local Turkey Farm-1 Pictograph of: Pumpkins Harvested Last Year from Old McGrover's Farm-2 Pictographs of: Corn Shucked and Eaten in a Day (no relation)-2 Pictographs of: Pumpkin Pie Sales a
Subjects:
Grades:
3rd - 6th
Types:
Pictograph Example - Thanksgiving Edition - FREE
Here is a real-world example of data pertaining to the Thanksgiving holidays with some nicely drawn illustrations.This example will help students easily understand data, why it is important, and how to use it in real-world situations.Package Includes:-1 Pictograph of: Turkeys Bought Last Year from the Local Turkey FarmThis slide is great for showing students the data on an overhead projector and discussing how the data changes throughout the year for specific reasons.Click “FOLLOW ME” if you lik
Subjects:
Grades:
3rd - 6th
Types:
Showing 1-16 of 16 results


