193 results
3rd grade graphing homeschool curricula
5th Grade Science Test Prep NGSS Science Review, Data Tables and Graphing
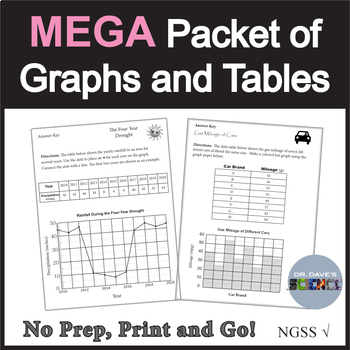
A huge collection of 37 science graphing activities from all my elementary science units. Great for 4th and 5th grade science review, an independent work packet, or as a folder for science substitute lesson plans. Here is the perfect resource to help your students become experts in graphing! Covers life, earth and physical science topics. The packet is a collection of ready-to-go practice graphing worksheets and data tables sure to help your students master graphing skills. Some of the science
Subjects:
Grades:
3rd - 5th
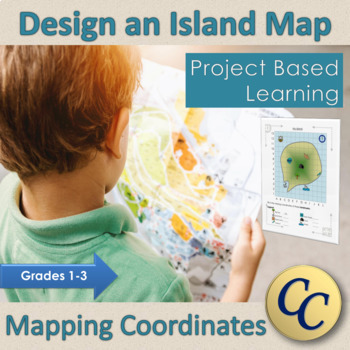
Design an Island Map A Coordinate Grid Project-Based-Learning Activity
Project based learning for coordinate graphing. Teach your students the basics of the coordinate system (or location on a grid) with this no-prep resource. Perfect for in class learning, remote learning, or supply teachers! Students are able to design their own island while learning about the coordinate system. ⏰ 2 or 3 classes of work for most students, but sometimes takes 4 depending on how much detail students add. (1 or 2 classes for the tutorial and practice map, 1 or 2 classes for designi
Subjects:
Grades:
1st - 3rd
NGSS:
2-ESS2-3
Also included in: Primary Project Based Learning Bundle Canadian
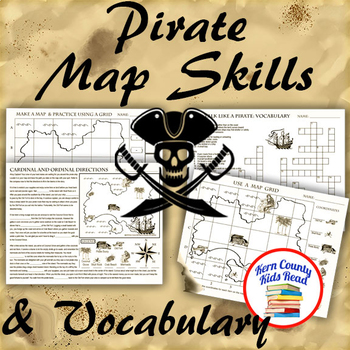
Pirate Map Skills: Grid Coordinates, Cardinal & Ordinal Directions, Symbols
Teach and strengthen coordinate grid math, geography mapping skills like map symbols and cardinal and ordinal directions with a compass rose, and new vocabulary with these pirate themed printable worksheets. These are fun mini-lesson activities for Talk Like A Pirate Day on September 19th or if you have a pirates themed unit. Cardinal directions and coordinate grid mapping are important introductory skills to mastering latitude and longitude map skills and being able to use an atlas. Coordinate
Subjects:
Grades:
3rd - 6th
Also included in: Pirates Thematic Unit Study Bundle: Talk Like A Pirate Pack!
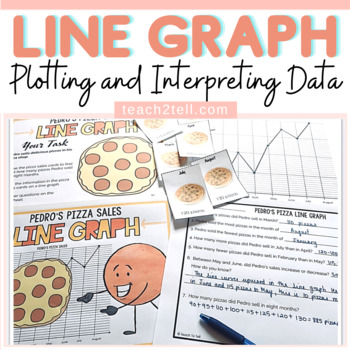
Line Graph Activity | Plotting and Interpreting Data on a Line Graph
Looking for a line graph activity that involves plotting and interpreting data on a line graph? Your students will enjoy this hands-on center activity that involves recording pizza sales over a given period using card visuals. They will get to plot and interpret data on a line graph.Items IncludedFile folder cover (2 options): if placing all items in a file at a centerSingle large task card (color and blackline) on a sheet outlining the taskTwo small task cards (color and blackline) on a sheet o
Subjects:
Grades:
2nd - 5th
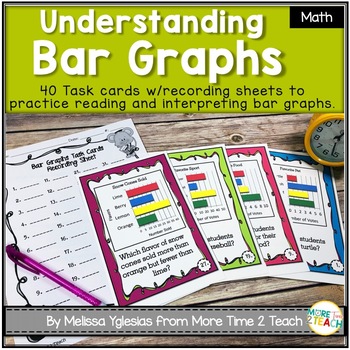
Graphing and Data: Bar Graphs Task Cards
Help your students develop proficiency reading and understanding bar graphs with these 40 MATH TASK CARDS! Each printable page includes 2 large task cards making it easy for students to analyze each graph. Use these task cards to teach/practice the fundamental skill or prep for test day!THIS PRODUCT INCLUDES:*40 task cards focusing on solving one and two-step problems using the information presented in scaled bar graphs. *student recording sheet*answer keyUSEFUL IN MANY WAYS!Once printed and lam
Subjects:
Grades:
2nd - 5th
Also included in: Graphing Task Cards Bundle
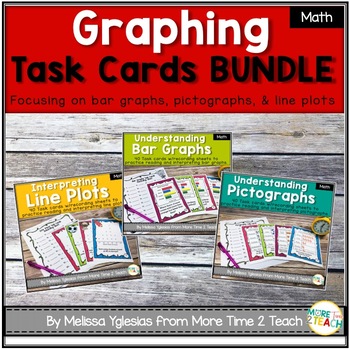
Graphing Task Cards Bundle
Task cards are a wonderful way of engaging students! I frequently use them in my classroom and my students love them. Personally I enjoy their versatility! I like being able to use them one day as a math center and another day as a warm up activity. Once you've printed the task cards and laminated them for durability the possibilities are endless!With this download you will receive 3 sets of graphing task cards for the price of 2... that's a savings of more than 30%! The sets included in this bu
Subjects:
Grades:
2nd - 5th
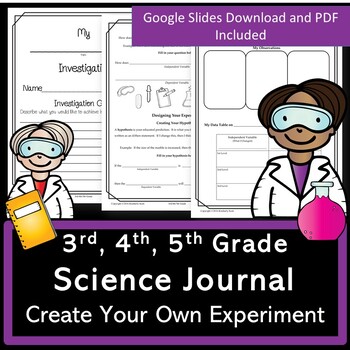
Science Experiment Journal Template | Digital Or Print | Grades 3 4 5
Are you looking to create hands-on investigations with your upper elementary students? Help students think like a scientist using a lab report template. Included are a student-editable Google Slide document and a PDF version. We will take you step by step in designing unique experiments on the topic of your choice. A Google Slide version is included. We feel this journal is great to assign students to perform an experiment at home. During this time of digital learning, students can use suppli
Subjects:
Grades:
3rd - 6th
NGSS:
3-5-ETS1-3
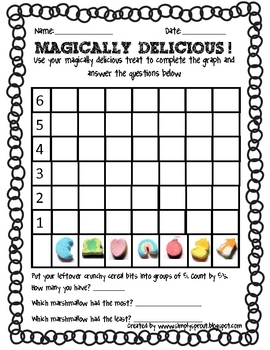
Magically Delicious Lucky Charms graphing
Get into the spirit of St. Patrick's Day with this "Magically Delicious" graphing activity. Students use a small handful of Lucky Charms cereal to complete a graph and to answer questions. Perfect for the primary classroom.
Subjects:
Grades:
PreK - 3rd
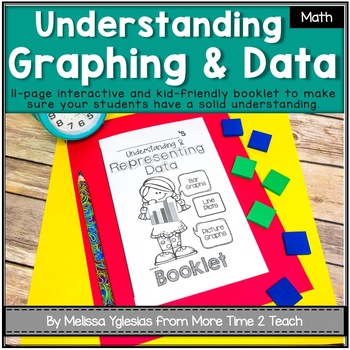
All About Data Theme Booklet {Mastering Pictographs, Bar Graphs, & Line Plots}
Do you always feel that you're short on MATH TIME in the classroom?Do you feel that your MATH TEXTBOOK is lacking in meeting your students needs?Are you looking for a QUICK and EASY TO USE math resource to make sure that your students are engaged in their math lesson and fully understand the standard?This ALL ABOUT DATA THEME BOOKLET which is geared towards 3rd grade, but can be used in 2nd and 4th grades as well, focuses on Standard 3.MD.3-4 {Represent and interpret data in pictographs, bar gra
Subjects:
Grades:
2nd - 4th
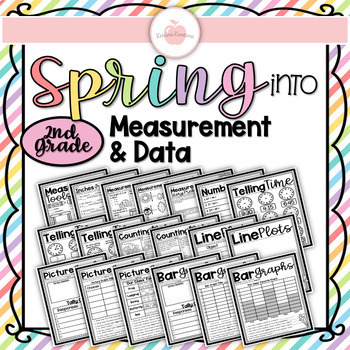
((19 PAGES)) NO PREP TEST PREP! Spring into 2nd Grade Measurement & Data Bundle
(((19 PAGES))) NO PREP TEST PREP! Spring into 2nd Grade Measurement & Data BundleIncludes:Adding With Number Lines Worksheet (1)Bar Graphs Worksheets (3)Inches vs. Centimeters Worksheet (1) Line Plots Worksheet (2)Measurement Comparisons Worksheet (1)Measurement Estimation Worksheet (1)Measurement Story Problems Worksheet (1)Measurement Tools Worksheet (1)Counting Coins and Money Worksheets (2)Picture Graphs Worksheets (3)Telling Time and AM PM Worksheets (3)Thank you for purchasing! Your fe
Subjects:
Grades:
1st - 3rd
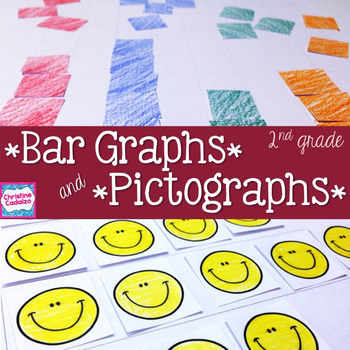
Pictograph and Bar Graph Math Unit- Second Grade
Complete math unit for teaching Common Core standard 2.MD.10- making and reading pictographs and bar graphs. This unit covers the following pictograph & bar graph concepts:Reading Bar Graphs: -what a bar graph is and why we use them-reading the title and labels of a bar graph-understanding a bar graph scale-finding how many in each category-strategies for answering addition and subtraction questions based on the bar graph dataMaking Bar Graphs:-making a four category bar graph-making a singl
Subjects:
Grades:
1st - 3rd
CCSS:
1:49
Classifying Quadrilaterals Musical Lesson w/ Worksheets, Game & Poster
Come join in on the fun at Camp Quadrilaterals as the campers sing around the campfire to their favorite shapes song. After watching the animated music video, play our printable game, or even create one of wall-sized posters (possible from a conventional printer). Illustrated worksheets and word problems await the inquiring students who will be unusually motivated after watching our engaging video.Components. • Animated music video [HD Download] Our flagship product. Each takes 250+ hour
Grades:
2nd - 5th
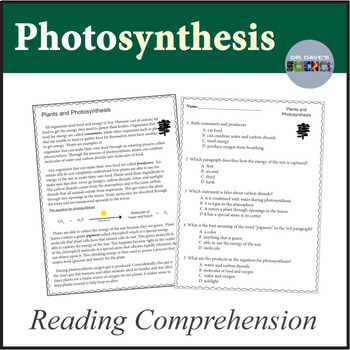
Photosynthesis Reading Comprehension Passage
The informational text covers photosynthesis and the process through which plants make their own food. The reading passage comes with a multiple choice question sheet, answer key, and writing prompt worksheet. There is also one-page photosynthesis worksheet graphing activity where students make a line graph of photosynthesis data. A question worksheet with answer key is also provided. Aligns to NGSS 5-LS1-1.This article is also found in an Elementary LIFE SCIENCE READING BUNDLE__________________
Subjects:
Grades:
3rd - 5th
NGSS:
5-LS1-1
Also included in: Photosynthesis Activities, Worksheets and Unit Bundle
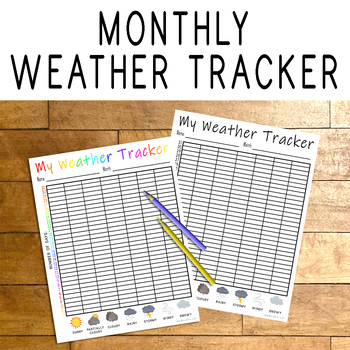
Monthly Weather Tracker
Track the weather for the month by coloring in a space on the bar graph for the type of weather each day!This comes with two weather tracking activity pages (one with rainbow lettering and daily numbers and one with all black text).
Subjects:
Grades:
PreK - 5th
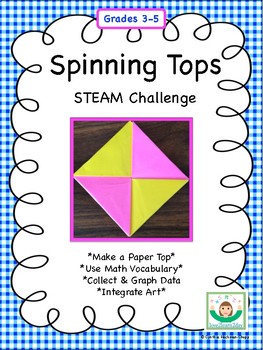
Spinning Tops: STEAM Challenge
Update (6/14/2017): The size of this pdf has more than tripled! If you've already purchased and downloaded, be sure to grab an updated copy!
This would make a fabulous STEM activity to end the school year...especially if your school has banned fidget spinners! On the day that I announced that we would be using fidget spinners for a math activity, I learned that the gadgets were now banned. I started from scratch, making a new activity to inspire students...this time, with tops that THEY create!
Subjects:
Grades:
3rd - 5th
Types:
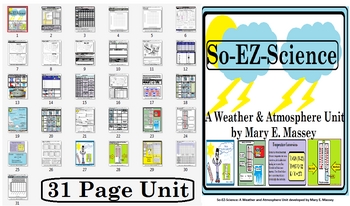
So-EZ-Science: Weather & Atmosphere Unit
This unit is a balanced literacy unit covering areas such as: temperature conversion, making a rain guage, recording weather, using weather station symbols, using the Beaufort Wind Scale, fronts, cloud types, cloud cover, graphing precipitation, graphing temperature, graphing weather phenomenon, weather tools, relative humidity, calculating relative humidity, precipitation, interpreting weather symbols on a weather map, reading a weather map, wind velocity, wind direction, wind speed, reading a
Subjects:
Grades:
3rd - 12th, Higher Education, Adult Education, Staff
Skittles Fractions, Estimation, and Graphing
Ready for some hands-on, "real-life" experience with fractions, estimation and graphing? With SKITTLES candy! What could be more fun than edible math? This unit includes:
-Teaching Notes
-Estimation
-Data Collecting with options* for either Fractions alone or Fractions & Percents together
-Bar Graphing
-Line Plot: a big emphasis in the Common Core State Standards
-Pie Chart: two options for differentiation*
-Problem Solving
*Note: I've included options on several tasks to allow for dif
Subjects:
Grades:
3rd - 6th
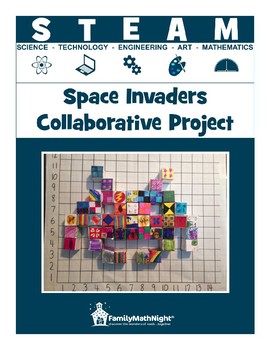
STEAM: Space Invaders Collaborative Project
Get kids excited about math with this fun hands-on collaborative project. Typically done during a Family Math Night event, this project can also be done in the classroom. The best part is, each person is individually represented in the final product! In this blast from the past, participants will be designing cubes and plotting them on a coordinate grid to create a 3-D alien from the popular 1978 video arcade game Space Invaders.Included in the lesson plan:• list of materials needed• math and sc
Subjects:
Grades:
K - 6th
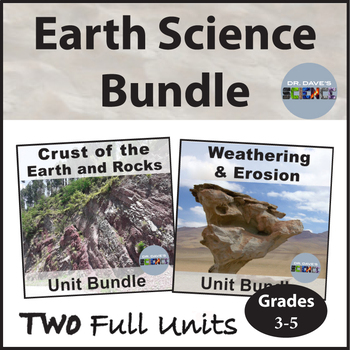
Earth Science Curriculum Bundle, Erosion and Weathering Crust of the Earth
A bundle of TWO Earth science units for an elementary earth science curriculum. Includes Weathering and Erosion, and the Earth’s Crust and Rocks. Each unit contains everything you need for a comprehensive, rigorous and engaging earth science unit on that topic. Lots of activities, worksheets, Powerpoints, and so much more. Please see the individual unit previews to view the specifics of each unit. All units aligned to NGSS. You save 20% on each unit when purchasing this bundle.These units are
Subjects:
Grades:
3rd - 6th
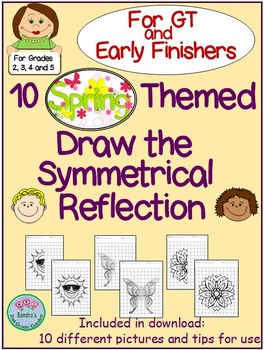
10 Spring Themed "Finish the Symmetrical Drawing" for GT and Early Finishers
My Students LOVE these!
Excellent challenge for GT students and early finishers.
10 Challenging Spring pictures to complete.
Students use spatial reasoning skills and graphing to complete each picture.
Students may color picture when completed.
Completed pictures included for reference.
Grades:
2nd - 5th
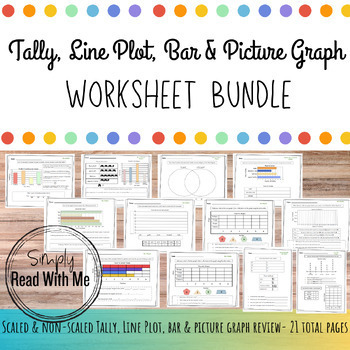
Bar, Picture, Line Plot & Tally Graph Practice Bundle (Scaled & Non-Scaled)
Help your learners master:- tally graphs- line plot graphs- picture graphs- bar graphs Learners are creating, comparing, and answering questions to deepen understanding in fun and engaging ways with this graphing bundle! 19 total worksheets included with this bundle in addition to an EDITABLE Graphing Jeopardy game in Google Slides! This resource is perfect for small groups, homework, sub plans, review, and homeschool curriculum practice!⭐️DOWNLOAD THE PREVIEW FILE TO SEE THIS RESOURCE IN MORE D
Subjects:
Grades:
1st - 3rd
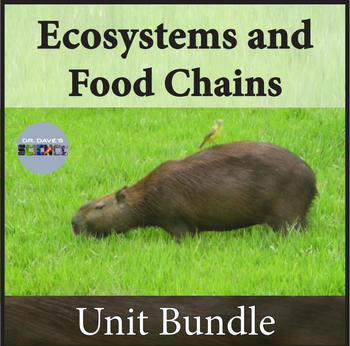
Ecosystems Interactions and Food Chain Unit Bundle 5th Grade NGSS Science
A unit bundle for ecology, food chains and the flow of energy through the environment from the sun. Optimum for grades 3-5 science. The bundle contains all of the resources below. NGSS 5-LS2-1, NGSS 5-PS3-11. 40-slide PowerPoint on Ecology and Food Chains. Slides cover producers, consumers, ecosystems, community, population, decomposers, herbivores, carnivores, omnivores, food chains, food webs, scavengers.2. Food Chain Reading Comprehension with multiple choice question sheet and writing prompt
Subjects:
Grades:
3rd - 6th
NGSS:
5-LS2-1
, 5-PS3-1
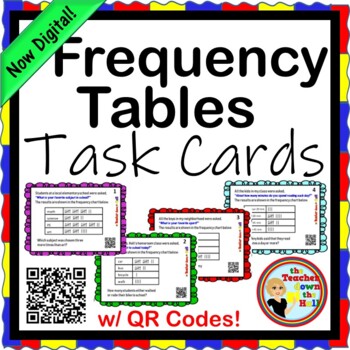
Frequency Tables Task Cards w/ QR Codes NOW Digital!
**NOW FORMATTED FOR YOUR DISTANCE LEARNING NEEDS!** Need more practice analyzing frequency tables? Students will read about a survey that was conducted and view the results in a frequency table. Then they'll be asked a question that could require addition, subtraction, or multiplication to solve correctly. Lots of visual tally mark practice! Great for math centers!There are 20 self-checking cards. They can check their own answers using the QR codes or turn in completed task sheet to be gra
Subjects:
Grades:
3rd - 5th
MATH GRAPHS & DATA Introduction to Various Graph Types PowerPoint PPT
This is a 36-slide PowerPoint presentation that provides the following information:
1. graphing vocabulary (data, scale, axis, interval, range, outlier);
2. definitions of and examples of 8 types of graphs (bar graph, double bar graph, line graph, line plot, stem-and-leaf plot, circle (pie) graph, pictograph, and histogram); and
3. a practice slide (with an answer slide to follow) for each type of graph.
Enjoy!
Deanne Davis, MCPSS
Subjects:
Grades:
3rd - 9th
Showing 1-24 of 193 results


