39 results
High school statistics activities for Microsoft Excel
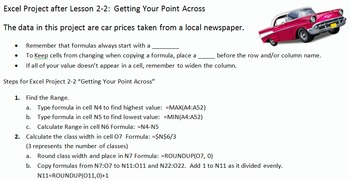
Excel Projects for Statistics Frequency Distributions and Charts
This file contains three different projects with solutions and a quick reference card for students. It correlates to Bluman's Elementary Statistics textbook.
First is an Introduction to Excel. There is an example, guided practice and then 4 Projects. The instructions are on each sheet. The topics covered are: basic editing and formatting, beginning charts, beginning formulas, such as SUM and AVERAGE, and calculations. There is an editable grading rubric for this project. The Preview file
Subjects:
Grades:
8th - 11th, Higher Education, Adult Education
Types:
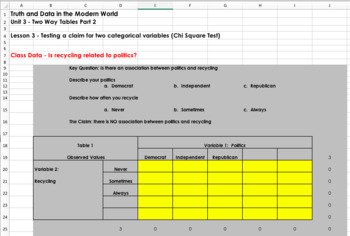
Teaching Statistics with Spreadsheets (Self Grading)
You can see a video that describes the basics of this course at the following link: https://www.youtube.com/watch?v=uZFpltXWyw8This package is an entire statistics course designed for content to be delivered, taught, practiced, and assessed through spreadsheets. Students learn basic statistics and spreadsheet skills. This course is intended to allow for student collaboration and group work throughout the learning process. Each spreadsheet is automatically graded so students can see their progres
Grades:
9th - 12th
Types:
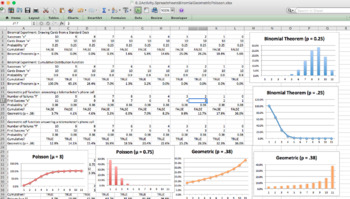
Statistics Spreadsheet Activity - Binomial, Geometric, Poisson (2 days)
Statistics Spreadsheet Activity - Binomial, Geometric, Poisson (2 days) This is a 1-2 day spreadsheet activity for a Statistics class. It uses spreadsheets as a walkthrough to allow students to explore the Binomial, Geometric, and Poisson distributions, as well as create graphs of the distributions. The product includes: 6.3 Spreadsheet Activity (Also included in " Statistics Unit 6 Bundle - Discrete Probability (12 days)" and in " A Mountain of Statistics Curriculum - One Full Year Bundle")Exce
Subjects:
Grades:
9th - 12th, Higher Education
Types:
CCSS:
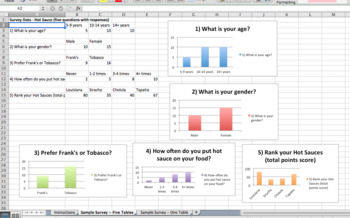
Statistics Unit 1 Project - Gathering Data (3 days)
This is an end-of-unit project for a Statistics class. It is introductory into survey methods, gathering data, using spreadsheets to organize data, creating charts, and presenting findings to the class. The Product includes: Instructions for studentsTeacher instructions for guidance on use and editingExcel spreadsheet with samplesGrading Rubric *The topics covered are survey methods - simple random, stratified, convenience, cluster, systematic - spreadsheets, charts, and presentations. The docum
Subjects:
Grades:
10th - 12th, Higher Education
Types:
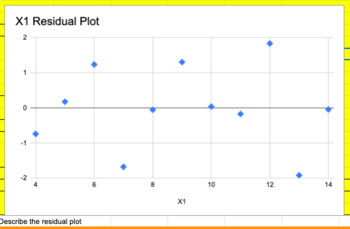
AP Statistics LSRL Activity - Is LSRL appropriate?
Just because r is strong, does that mean you can use a LSRL?This activity guides students to use excel/ google sheets to1. Graph scatterplots with trend lines/ labels2. Use XLMinter ToolPak to identify key statistics in linear regression analysis3. Identify and interpret R, R^2, S4. Graph and see residual plots7. Compare key statistics in four data sets to determine which is most appropriate to use LSRL.This file was originally created as a google sheet.A sample answer key is included.There are
Subjects:
Grades:
11th - 12th
Types:
CCSS:
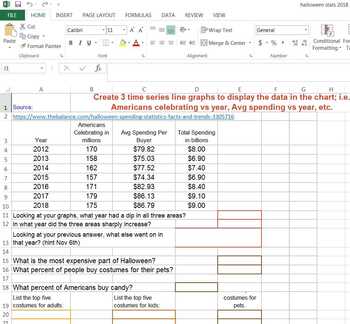
Halloween Statistics 2018 Spreadsheet Activity
If you are teaching stats and incorporating spreadsheets, this might fit the bill for a fun activity for Halloween. The plus is it does have some educational value, as well as a fun Mystery Image sheet, as well. Students go to a website and read statistical information, then they create line graphs and answer questions in the first spreadsheet. In the second, they are just practicing their spreadsheet formatting skills by following step-by-step instructions to create an image. There are two
Subjects:
Grades:
7th - 12th
Types:
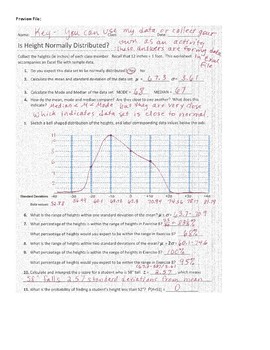
Is it normal? Height Data Activity
This activity was created to help introduce students to normal data distributions. This file contains an Excel workbook with instructions (for both 2010 and 2013 versions of Excel) for students to do the following:
Find the Mean, standard deviation, median, mode, and the distribution of data within a certain number of standard deviations from the mean.
Create bar graph and line chart of frequencies.
Answer questions regarding data on separate Worksheet.
This activity is totally editable, so you
Subjects:
Grades:
9th - 12th
Types:
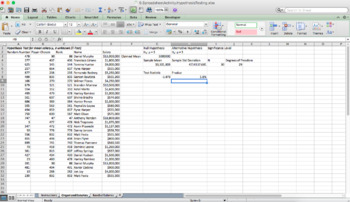
Statistics Unit 9 Spreadsheet Activity - Hypothesis Testing, VLOOKUP, T-Test
This is a 2 day spreadsheet activity for a Statistics class. It uses spreadsheets as a walkthrough to allow students to organize data, form a hypothesis, find the T-statistic and p-value and use the decision criterion. The activity uses VLOOKUP, RANDBETWEEN, AVERAGE, STDEV.S, ABS, SQRT, and TDIST built-in spreadsheet functions. The product includes: Unit 9 Spreadsheet Activity (in xlsx format)Teacher instructionsAnswer Key included. *The topics covered are Hypothesis Testing, One Sample T-Test,
Subjects:
Grades:
10th - 12th, Higher Education
Types:
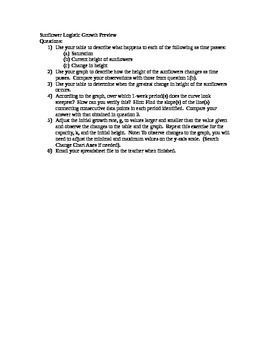
Logistic Growth Rate Project with spreadsheet or Google sheets.
This project uses sunflower growth to help students generate a logistic growth model. There are numerous video links to sunflower growth and time lapse videos of growth. Students examine saturation points as well as a way to understand that sunflowers can not get infinitely tall.Includes Smart Notebook presentation, starter Excel spreadsheet, and student direction sheet.
Subjects:
Grades:
10th - 12th
Types:
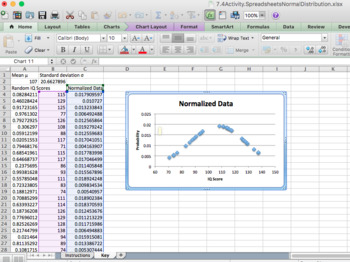
Statistics Spreadsheet Activity - Normal Distribution (1 day)
This is a 1 day spreadsheet activity for a Statistics class. It uses spreadsheets as a walkthrough to allow students to explore the Normal Distribution, as well as use the RAND function to simulate IQ scores to generate Normal data. The product includes: 7.4 Spreadsheet Activity (in xlsx format)Teacher instructionsAnswer Key included. *The topics covered are Normal distribution, RAND, NORMDIST, & INVNORM functions, as well as the absolute reference "$". The documents are Excel based, pdfs in
Subjects:
Grades:
9th - 12th
Types:
CCSS:
MATH LESSON & MATH LAB on NFL Quarterback Rating
Most people have heard of professional football and the NFL but few people know that there is an actual formula used to calculate ratings for the NFL quarterbacks! This is a tried and true math lesson and lab that I have created and used for many years with my 7th and 8th grade classes. Students get a "kick" out of learning about the actual formula used by the NFL to calculate passer ratings for the quarterbacks. They learn some history about when the rating of quarterbacks first started, anal
Subjects:
Grades:
6th - 10th, Adult Education
Types:
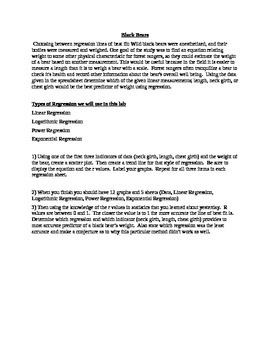
Comparing Linear, Quadratic, Exponential Regressions w/Spreadsheets
This project incorporates spreadsheets with scatter plots and lines of best fit. It asked students to perform various regressions, such as linear, power, exponential, and logarithmic, The students are asked to generate an model to help park rangers determine the weight of black bears by using only one of three measures, neck girth, length, and chest girth. Calculating the bears weights allow the rangers to anesthetize them in order for them to care for the bears. The r values in this project
Subjects:
Grades:
9th - 12th
Types:
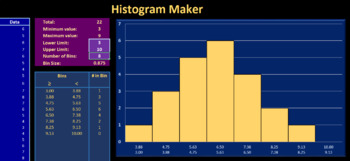
Histogram Maker - Excel
This Excel spreadsheet produces a nicely formatted histogram that updates in real time with your data and parameters. All you have to do is enter your data, choose your upper and lower limits, and specify the number of bins.This spreadsheet is locked to avoid user error, but can easily be unlocked to allow for the editing of formulas and formatting.Note: This spreadsheet does not utilize Excel's histogram function, making it more accessible for those who do not have the Data Analysis Toolpack ad
Subjects:
Grades:
6th - 12th
Types:

Homeostasis Heart Rate Lab
This lab can be used for middle school sciences, any Biology-based science class, or mathematics statistics classes. Included are a word document with instructions, lab, an excel spreadsheet with example data, a blank sheet with formulas that will calculate data, and a PowerPoint with student instructions.
Subjects:
Grades:
6th - 12th, Higher Education
Types:
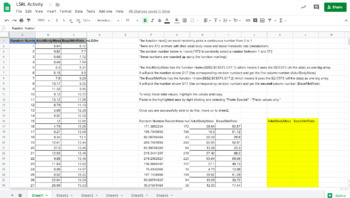
AP Statistics LSRL Transformations and Inference Activity with Excel
This activity guides students to use excel/ google sheets to1. Randomly select from a data set2. Transform the data into a power model3. Graph scatterplots and histograms of the data and residual plots4. Use XLMiner ToolPak to identify key statistics in the regression analysis5. Identify and interpret R, R^2, S, b0, b1, SEb16. Construct a confidence interval7. Identify the t-value and p-value for hypothesis testsThis file was originally created as a google sheet.A sample answer key is included.T
Subjects:
Grades:
12th, Higher Education
Types:
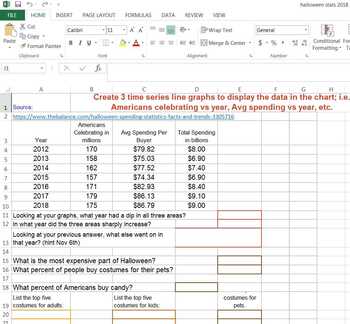
Halloween Statistics 2018 - Google Sheets
This activity has students read an online article with current statistics related to Halloween, then make line graphs and answer questions on a Google sheet. The second sheet is a mystery image that appears after you apply the step-by-step formatting instructions. It has a little real math and a little fun, so I use it for Halloween in my statistics classes. The pictures are from my Excel version, but they are very similar. The main difference is that I have fun pictures in this version. To
Subjects:
Grades:
7th - 12th
Types:

Stock Market Simulation
This product has a full lesson on how to teach students about the stock market. This allows them to actively work with different stocks to find out how stocks can shift and change over time. It can be adapted as a 9 weeks, semester, or even full year project.Included is an introductory PowerPoint, a sample Excel spreadsheet, a handout of the project instructions and a list of tips that I've learned using this that will help you out. This project was originally designed with an Economics class in
Subjects:
Grades:
6th - 12th, Higher Education, Adult Education
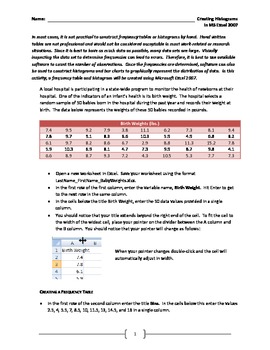
Creating Frequency Tables and Histograms in MS Excel 2007
This activity looks at a realistic data set and walks the student through constructing a frequency table and histogram using Microsoft Excel. It should be noted that Excel is not the best software package for creating histograms, but because it one of, it not the most widely used software package for data storage and presentation in business, it is important to know how to create professional-looking and statistically accurate graphics using this tool.
There are two different ways to constru
Subjects:
Grades:
11th - 12th, Higher Education
Types:

Data Tables and Key
Tables of Random Data for use with statistics. EAch table has 7 piece of data. Also the commands are in the excel file so that numbers can be changed. The key is included that is set up to display the equivalent angles in a pie chart, gives Q!, 2, 3, and max and min. Used for beginning STATs
Subjects:
Grades:
7th - 11th
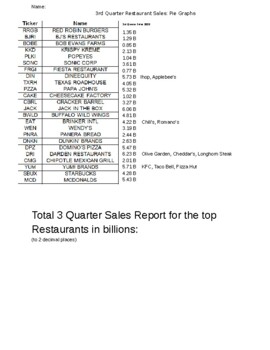
Business Statistics Graphing Project
After studying statistics in business and pie graphs, this is great culminating project. Students graph information for the 3rd quarter restaurant sales in the United States, for 2020, the middle of the pandemic. They will graph, research, and think about owning a business during uncertain times.
Subjects:
Grades:
11th - 12th
Types:
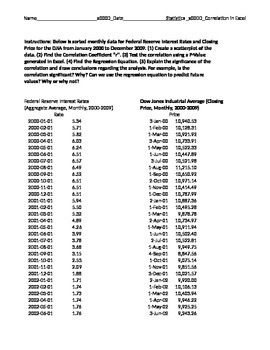
Correlation and Regression Activity - Interest Rates and the Dow
This is an activity in Microsoft Excel that analyzes interest rates set by the Federal Reserve and price of the Dow Jones Industrial Average from 2000 to 2009. This activity is intended for high school and college level statistics classes (also applies to economics classes). Students will use REAL DATA (included) to (1) create a scatter plot, (2) find the correlation coefficient using data analysis toolpak (or StatsPlusLE for Mac), (3) Test the significance of the correlation using P-values, (4)
Subjects:
Grades:
9th - 12th, Higher Education
Types:
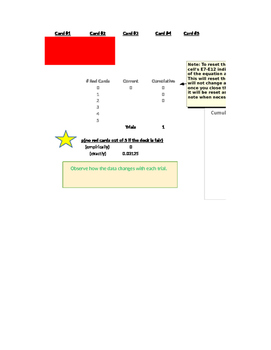
Draw 5 Cards Excel Simulator
This Excel file is a simulator that draws five cards with replacement. It shows whether they are red or black and keeps track of the amount of red cards for each draw. This is then kept track in a table. As each trial continues, there is a graph showing how many red cards were drawn out of 5. Students will quickly see the importance of a large amount of trials as they see the middle of the graph grow quickly.
There is a probability worksheet available to be used in conjunction with this s
Subjects:
Grades:
7th - 11th
Types:
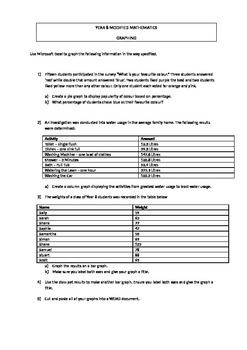
Using ICT to investigate Statistics
A quick activity encouraging students to incorporate the use of ICTs into their learning about Statistics. Requires them to use Microsoft Excel to create different types of graphs based upon the statistics given in the worksheet.
Subjects:
Grades:
4th - 10th
Types:
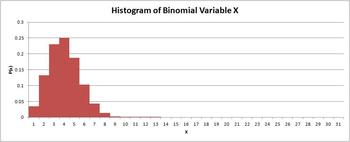
Normal Approximation to the Binomial Demonstration
This interactive Excel worksheet uses a histogram to demonstrate to students the conditions under which a normal distribution can be used to approximate binomial probabilities. Users can change the values of n and p, and the histogram will update automatically. The binomial probabilities are also updated with each change. Students will be able to clearly see when the histogram approaches a mounded and symmetric distribution. The bars of the histogram are wide enough for students to be able t
Subjects:
Grades:
9th - 12th, Higher Education
Types:
Showing 1-24 of 39 results


