67 results
Elementary problem solving graphing lectures

Design Thinking - Full Content Presentation
Design Thinking is a constructivist way of approaching a problem that seeks empathy to leverage a bias toward action in order to find a radical solution to the end user’s need. The Design Thinking mindset has been pioneered by companies and institutions like IDEO and Stanford and has crept into Education over the last decade. This presentation is a 56-slide PDF of a Google Slides deck intended to deliver high-quality content to your class. The content defines each step of the Design Thinking pr
Subjects:
Grades:
5th - 12th, Staff
Types:
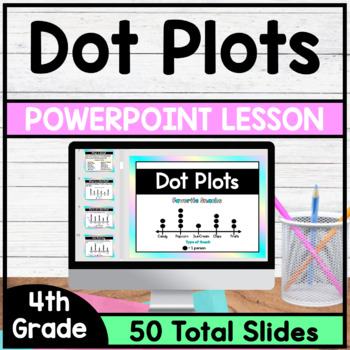
Dot Plots - PowerPoint Lesson
This is a PowerPoint Lesson that focuses on Dot Plots. This PowerPoint Lesson goes through the complete lesson plan cycle. In this lesson students will learn about the parts of a dot plot and will understand how to summarize data on a dot plot. *This PowerPoint Lesson has everything you need to teach a lesson. Just download and begin teaching. This lesson includes Direct Instruction Slides, Guided Practice Slides and Independent Practice Slides. (Printable Version of Guided Practice Questions
Grades:
4th
CCSS:
Also included in: 4th Grade Math PowerPoint Lessons - Bundle
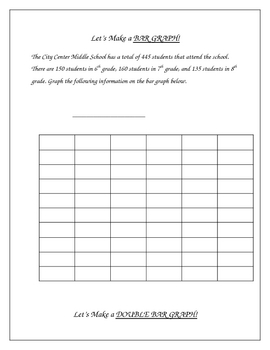
Constructing Graphs - Bar Graphs, Line Graphs, Circle Graphs
**I revised the numbers in the pie graph on this from the first version, these amounts are much more friendly** This activity includes construction of a bar graph, double bar graph, line graph, double line graph, and a circle graph.I put this together after being frustrated about not being able to find any graphing activities appropriate for intermediate grades that would allow me to make graphs with the class on my smartboard. I needed some examples to demonstrate how to take data and create a
Subjects:
Grades:
3rd - 10th, Adult Education
Types:
Spy: Secret Lives of Spies. Cause, Effect, and Problem Solving
Students learn about the relationship between cause, effect, and problem-solving while exploring the secret lives of spies. Who knew? Spies have problems too!Why Spy?Pocket Litter, Bang and Burn, Chicken Feed, Cobbler, Dead drop. Could you speak like a spy? Could you live like a spy? Students love exploring the world of secret agents and the roles they play in protecting their countries. Espionage was born out of a need to solve problems. Those problems might include acquiring enemy secre
Grades:
5th - 8th
Types:
Also included in: Codes, Lives of Spies, and a Spy Simulation! Spy Bundle #4
Solution Focused Problem Solving Lesson with Worksheet
Teach and practice problem solving life skills with a whiteboard and dry erase markers.Resource includes:-Step by step interactive whiteboard lesson using a house to increase engagement. This fun layout may be used as an anchor chart.-1 worksheet for practicing problem solving skills independently and/or with the group.-List of evidenced-based solution focused questions.The following problem solving techniques are highlighted in the lesson:-Agree on a problem to solve-Discuss the consequences of
Grades:
3rd - 6th
Types:
Histograms and Frequency Tables (Powerpoint) for Busy Teachers
This powerpoint presentation introduces the concept of histograms and frequency tables.
Clipart, sounds, and animation are used sparingly and effectively to help illustrate points without being distracting. This powerpoint presentation has been extensively refined using faculty AND student input and feedback.
Definitions of histogram, interval, frequency table, and frequency are all presented. The progression from a frequency table to a completed histogram is illustrated and animated using
Subjects:
Grades:
4th - 12th, Higher Education, Adult Education

Applying Kelso's 9 choices conflict resolution powerpoint!
This resource gives a breakdown to each Kelso's choice. The beginning gives an overview of the differene in big and small problem (given that you have already discussed it in detail). Each slide gives explanations to when, where, why, and how you would use each Kelso's choice. I would suggest using this throughout the school year and having students act out each choice! I hope you enjoy! This presentation could be broken down into months, weeks, days, etc. This could look like introducing the ni
Grades:
PreK - 5th
Situation-problème (type Ministère) - 3e cycle
« Un souper quasi-parfait ! » est une situation-problème en mathématiques destinée aux élèves du 3e cycle du primaire.Ma partner de 6e année et moi aimions beaucoup cuisiner avec nos groupes. Une idée nous ait venue un jour … créer une situation-problème sous le thème de l’alimentation à la manière de l’émission télévisuelle «Un souper presque parfait». Parfait pour le mois de mars où les notions de nutrition et de la santé sont abordées. Dans cette situation-problème, les élèves sont amenés à c
Subjects:
Grades:
5th - 6th
Types:
Science Challenge of the Week Bundle
Challenge your students to figure out what is scientifically wrong in each picture. Pictures vary from animals, plants, weather, space, geographic location, and more. An answer key is included.Print off the PDF documents and display them in your classroom or project them on a screen.This is a great way to kick off a new unit or review an old concept learned. Students use critical thinking and problem solving skills that can lead to thoughtful and in-depth conversations. Want a sample before
Subjects:
Grades:
1st - 3rd
Types:
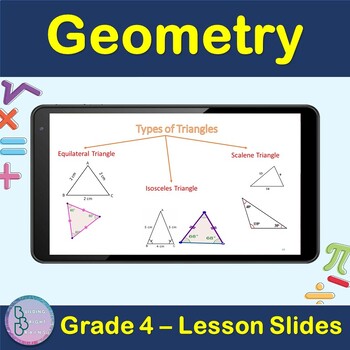
Geometry | 4th Grade PowerPoint Lesson Slides Line Circle polygon Triangle
Are you teaching your students about Geometry For 4th Grade? Plenty of examples and application exercises are included. You can also easily convert this to a Google Slides lesson by dragging it into your Google Drive.What is included?✦ 49 total slides for notes, examples and applications.✦ All steps are animated to allow the teacher to explain them gradually. At the end of the lesson, students will be able to Apply✦ Point, Line, Line segment✦ Angles, Parallel and perpendicular lines✦ Circles✦ po
Grades:
3rd - 5th

Notes - Introduction to Inequalities
These are notes used to introduce students to inequalities. Students will represent inequalities graphically (on a number line), translate an inequality in words to an inequality using symbols and graph, state whether a number is in the solution set of an inequality and write and graph inequalities that represent real-life situations.
Grades:
5th - 8th
Types:
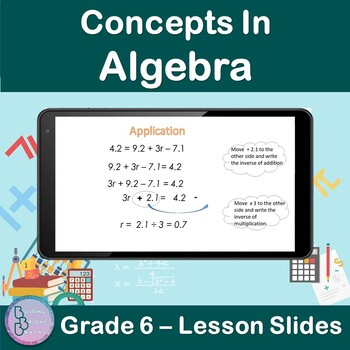
Concepts in Algebra | 6th Grade PowerPoint Lesson Slides | Algebraic Patterns
Are you teaching your students about Concepts In Algebra For 6th Grade? Plenty of examples and application exercises are included. You can also easily convert this to a Google Slides lesson by dragging it into your Google Drive.What is included?✦ 47 total slides for notes, examples and applications.✦ All steps are animated to allow the teacher to explain them gradually. At the end of the lesson, students will be able to✦ Solve Algebraic Patterns ✦ Solve Two-Step Equations✦ Solve Addition and Sub
Grades:
5th - 7th
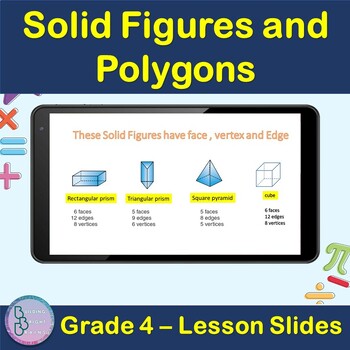
Solid Figures and Polygons | 4th Grade PowerPoint Lesson Slides
Are you teaching your students about Solid Figures and Polygons For 4th Grade? Plenty of examples and application exercises are included. You can also easily convert this to a Google Slides lesson by dragging it into your Google Drive.What is included?✦ 11 total slides for notes, examples and applications.✦ All steps are animated to allow the teacher to explain them gradually. At the end of the lesson, students will be able to ✦ Define Polygons✦ Define Solid figures✦ Understand Solid figures Fac
Grades:
3rd - 5th
Data Representation Powerpoint
The presentation contains: 1) TALLY MARKS Learning Objectives. Definition of a tally mark. Uses of tally mark. How to count a tally mark. Tally Mark Chart. Construction of a tally mark table with an example. Application on real life problems on tally mark. Read and Interpret a tally mark table.The presentation contains: 2) FREQUENCY DISTRIBUTION TABLEDefinition of a Frequency Distribution Table. Types of Frequency Distribution Table: a) Discrete Frequency Distribution Table (Ungrouped).b) C
Subjects:
Grades:
1st - 10th, Higher Education, Staff
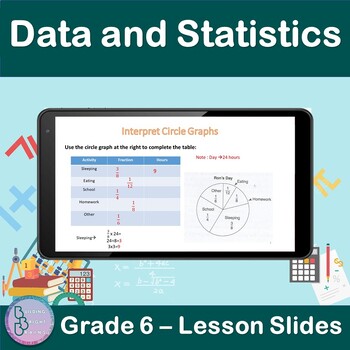
Data and Statistics | 6th Grade PowerPoint Lesson Slides | Circle Graphs
Are you teaching your students about Data and Statistics For 6th Grade? Plenty of examples and application exercises are included. You can also easily convert this to a Google Slides lesson by dragging it into your Google Drive.What is included?✦ 9 total slides for notes, examples and applications.✦ All steps are animated to allow the teacher to explain them gradually. At the end of the lesson, students will be able to✦ Interpret Circle Graphs.✦ Use a circle graph to complete s table.✦ Use a cir
Subjects:
Grades:
5th - 7th
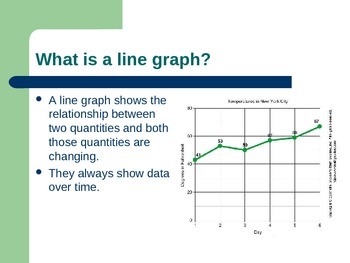
Graphing Powerpoint
This is an introductory PowerPoint graphing. The PowerPoint includes:
-Different types of graphs
-Vocabulary used to construct a graph
-How to construct a line graph
Notes of formatted is such a way that they can easily be used in A.V.I.D. Cornell Note style with the heading being used as the question in the left column and the notes for the right column.
Subjects:
Grades:
5th - 7th
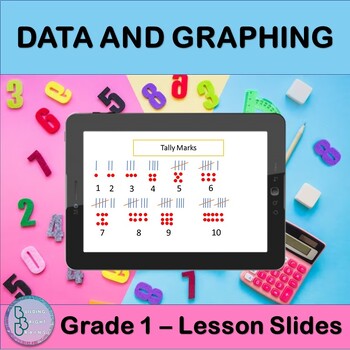
Data and Graphing | PowerPoint Lesson Slides Tally Chart Pictograph Bar Graph
Are you teaching your students about Data and Graphing? This resource is great for you for First Grade! Plenty of examples and application exercises are included. You can also easily convert this to a Google Slides lesson by dragging it into your Google Drive.What is included?✦ 6 total slides for notes, examples and applications.✦ All steps are animated to allow the teacher to explain them gradually. At the end of the lesson, students will be able to ✦ Make a Tally Chart✦ Make a Pictograph✦ Read
Grades:
1st - 2nd
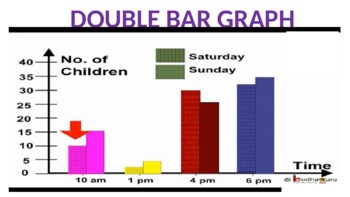
Double Bar Graph Powerpoint
The presentation contains:Learning Objectives.Definition of a double bar graph.Parts of a double bar graph.Difference between bar graph and double bar graph.Tips for construction of double bar graph.Steps to construct double bar graph with an example.To read and interpret the double bar graph.
Subjects:
Grades:
5th - 10th, Staff
Also included in: Data Representation Powerpoint
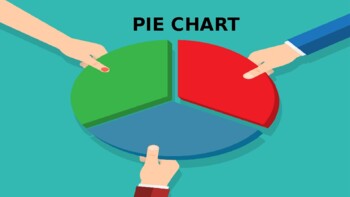
Pie Chart Powerpoint
The presentation contains:Learning Objectives.Definition of a Pie Chart.Tips for construction of pie chart.Steps to construct a pie chart with an example.Scaling and drawing a pie chart.Read and Interpret a pie chart.
Subjects:
Grades:
5th - 10th, Staff
Also included in: Data Representation Powerpoint

Stop, Think, and Choose Video Lesson
This lesson provides a simple method for students on critical thinking skills and the Stop, Think, and Choose method. A video lesson for students is provided, along with a PowerPoint suitable for Grades 1-3.
Grades:
1st - 3rd
Types:

KEEN PÅ TEAM
KEEN PÅ TEAM oppfordrer til felleskap og mestring gjennom samarbeid. Oppgavene kan brukes på ulike måter og kan lett tilpasses nivå. Mange tips til gjennomføring er med. TEAMWORK!Elevene skal jobbe sammen i par eller små grupper. Oppgaven består seg i å se oppgaver, huske bilder/ord/tekst/tall/mønster for så å skrive/tegne det ned. Elevene skal se på/studere oppgavene i en gitt tid. - 6 oppgaver med bilder: Trelydsord, firelydsord, sj- og kj-ord, diftonger, ng- og nk-ord, ord med dobbel konsonan
Grades:
1st - 5th
Types:
Line Graph Powerpoint
The presentation contains:Learning objectives.Definition of a line graph.Parts of a line graph.Tips for construction of line graph.Steps to construct line graph with an example.Reading and Interpreting a line graph.Advantage of line graph.
Subjects:
Grades:
5th - 10th, Staff
Also included in: Data Representation Powerpoint
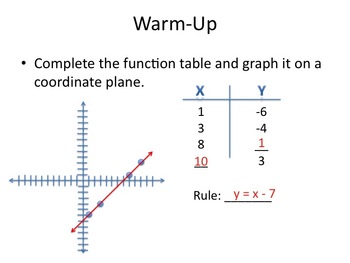
Graphing Linear Equations (focus on Real-Life Situations)
This PowerPoint can be used to introduce students to graphing linear equations. It should be played as a slideshow, where it steps students through linear equations by starting with the basic idea of graphing a function. The presentation ramps up to focusing on real-life situations that might be represented by a function. The show ends by looking at different graphs and asking students to think of a real-world situation that might match the given graph.
Grades:
5th - 8th
CCSS:
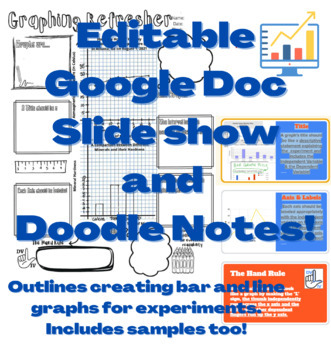
Scientific Graphing EDITABLE Google Slide Show with Keys and Doodle Note Sheet
This Slide Show does a wonderful job outlining key aspects of graphs including: Line and bar graphs, accurate titling, axis, and scaling. The doodle note sheet gives two examples of correct graphs, in addition to encouraging students creativity. It will help your students create their own graphs to represent their data in future experiments from start to finish.
Grades:
5th - 9th
Types:
Showing 1-24 of 67 results


