69 results
Elementary Easter graphing lectures
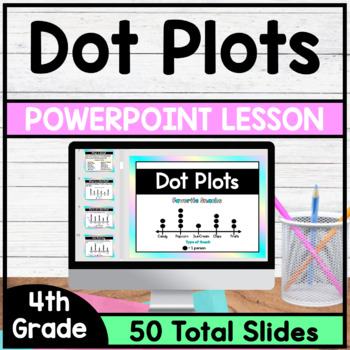
Dot Plots - PowerPoint Lesson
This is a PowerPoint Lesson that focuses on Dot Plots. This PowerPoint Lesson goes through the complete lesson plan cycle. In this lesson students will learn about the parts of a dot plot and will understand how to summarize data on a dot plot. *This PowerPoint Lesson has everything you need to teach a lesson. Just download and begin teaching. This lesson includes Direct Instruction Slides, Guided Practice Slides and Independent Practice Slides. (Printable Version of Guided Practice Questions
Grades:
4th
CCSS:
Also included in: 4th Grade Math PowerPoint Lessons - Bundle
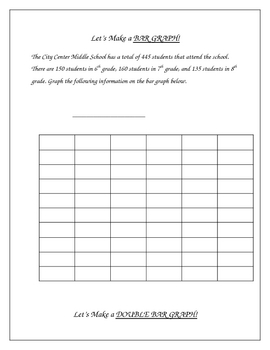
Constructing Graphs - Bar Graphs, Line Graphs, Circle Graphs
**I revised the numbers in the pie graph on this from the first version, these amounts are much more friendly** This activity includes construction of a bar graph, double bar graph, line graph, double line graph, and a circle graph.I put this together after being frustrated about not being able to find any graphing activities appropriate for intermediate grades that would allow me to make graphs with the class on my smartboard. I needed some examples to demonstrate how to take data and create a
Subjects:
Grades:
3rd - 10th, Adult Education
Types:
Histograms and Frequency Tables (Powerpoint) for Busy Teachers
This powerpoint presentation introduces the concept of histograms and frequency tables.
Clipart, sounds, and animation are used sparingly and effectively to help illustrate points without being distracting. This powerpoint presentation has been extensively refined using faculty AND student input and feedback.
Definitions of histogram, interval, frequency table, and frequency are all presented. The progression from a frequency table to a completed histogram is illustrated and animated using
Subjects:
Grades:
4th - 12th, Higher Education, Adult Education
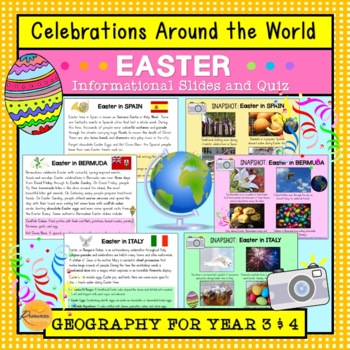
Celebrations Around The World: Easter
This resource introduces children to Easter traditions around the world in counties that include: Spain, Italy, Ethiopia, Bermuda, Australia, Germany and Greece. Learn about people celebrate Easter with their families, friends and communities through special events and traditional foods during this annual occasion. We have included plenty of photographs and amazing facts to engage your students! Additionally, we have included 10 multiple choice quiz questions to check their understanding. Wonder
Subjects:
Grades:
3rd - 4th
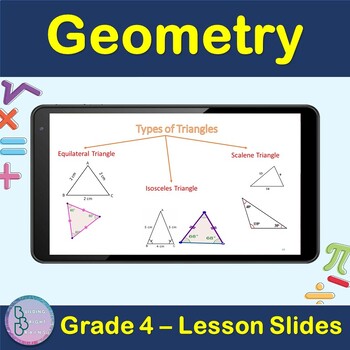
Geometry | 4th Grade PowerPoint Lesson Slides Line Circle polygon Triangle
Are you teaching your students about Geometry For 4th Grade? Plenty of examples and application exercises are included. You can also easily convert this to a Google Slides lesson by dragging it into your Google Drive.What is included?✦ 49 total slides for notes, examples and applications.✦ All steps are animated to allow the teacher to explain them gradually. At the end of the lesson, students will be able to Apply✦ Point, Line, Line segment✦ Angles, Parallel and perpendicular lines✦ Circles✦ po
Grades:
3rd - 5th

Notes - Introduction to Inequalities
These are notes used to introduce students to inequalities. Students will represent inequalities graphically (on a number line), translate an inequality in words to an inequality using symbols and graph, state whether a number is in the solution set of an inequality and write and graph inequalities that represent real-life situations.
Grades:
5th - 8th
Types:
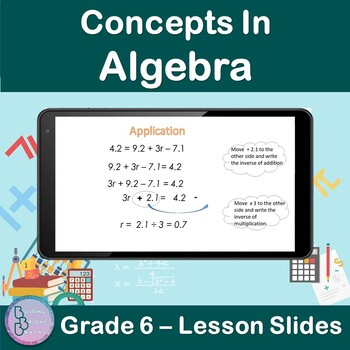
Concepts in Algebra | 6th Grade PowerPoint Lesson Slides | Algebraic Patterns
Are you teaching your students about Concepts In Algebra For 6th Grade? Plenty of examples and application exercises are included. You can also easily convert this to a Google Slides lesson by dragging it into your Google Drive.What is included?✦ 47 total slides for notes, examples and applications.✦ All steps are animated to allow the teacher to explain them gradually. At the end of the lesson, students will be able to✦ Solve Algebraic Patterns ✦ Solve Two-Step Equations✦ Solve Addition and Sub
Grades:
5th - 7th
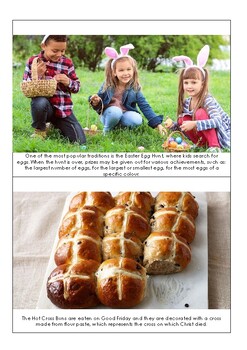
Easter traditions around the World Montessori Book
Three short books containing photos and descriptions of:- Easter traditions in Australia- Easter traditions in Europe- Easter traditions in South AmericaBooks are made for a Montessori environment, so they follow the colour code of continents where the given celebration is taking place.
Subjects:
Grades:
PreK - 1st

Comic Book Blank -PDF FORMAT
black and white comic book page for your worksheets or educational resources. All images are high resolution so you can have large versions of them and they'll still be clean and beautiful.PDF format Book "8 5x11 " 120p -no bleed
Subjects:
Grades:
K - 2nd
Types:
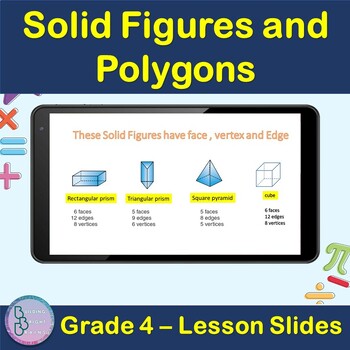
Solid Figures and Polygons | 4th Grade PowerPoint Lesson Slides
Are you teaching your students about Solid Figures and Polygons For 4th Grade? Plenty of examples and application exercises are included. You can also easily convert this to a Google Slides lesson by dragging it into your Google Drive.What is included?✦ 11 total slides for notes, examples and applications.✦ All steps are animated to allow the teacher to explain them gradually. At the end of the lesson, students will be able to ✦ Define Polygons✦ Define Solid figures✦ Understand Solid figures Fac
Grades:
3rd - 5th
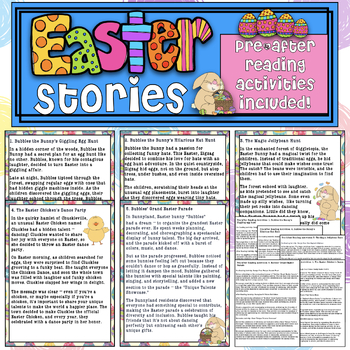
Easter Tales with valuable life lessons + Activites for primary Sts
Included in this product:- 5 short Easter Stories- 10 Pre/after reading activities + 1 extension activity for each story included in this pack Embark on an Educational Adventure with Enchanting Easter Tales for Your Classroom! Dive into a world of whimsy and wonder with our captivating Easter story collection designed to bring joy, creativity, and valuable life lessons to your classroom. Unlock Imagination with "Bubbles the Bunny's Giggling Egg Hunt": Take your students on a laughter-filled jou
Subjects:
Grades:
1st - 4th
Types:
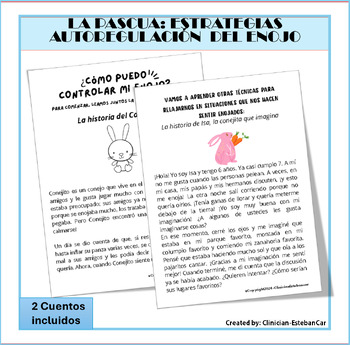
Actividades de afrontamiento para Easter Time o Primavera con más de5 lecciones
Con este material exploraremos juntos el fascinante mundo de las emociones y el enojo, todo ello inspirado en el tema de la Pascua. En este material de manejo y autoregulación emocional, descubriremos cómo el enojo puede convertirse en nuestro aliado, ayudándonos a comprender nuestras emociones y a manejarlas de la mejor manera. Incluye cuentos relacionados con la Pascua que nos enseñarán valiosas lecciones sobre el enojo y cómo manejarlo. También exploraremos estrategias de regulación emocional
Subjects:
Grades:
K - 5th
Types:
Data Representation Powerpoint
The presentation contains: 1) TALLY MARKS Learning Objectives. Definition of a tally mark. Uses of tally mark. How to count a tally mark. Tally Mark Chart. Construction of a tally mark table with an example. Application on real life problems on tally mark. Read and Interpret a tally mark table.The presentation contains: 2) FREQUENCY DISTRIBUTION TABLEDefinition of a Frequency Distribution Table. Types of Frequency Distribution Table: a) Discrete Frequency Distribution Table (Ungrouped).b) C
Subjects:
Grades:
1st - 10th, Higher Education, Staff
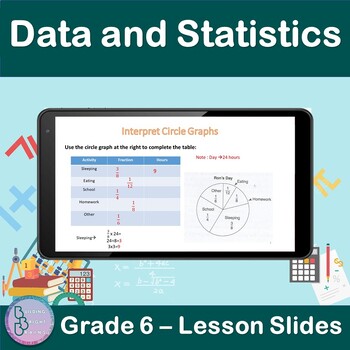
Data and Statistics | 6th Grade PowerPoint Lesson Slides | Circle Graphs
Are you teaching your students about Data and Statistics For 6th Grade? Plenty of examples and application exercises are included. You can also easily convert this to a Google Slides lesson by dragging it into your Google Drive.What is included?✦ 9 total slides for notes, examples and applications.✦ All steps are animated to allow the teacher to explain them gradually. At the end of the lesson, students will be able to✦ Interpret Circle Graphs.✦ Use a circle graph to complete s table.✦ Use a cir
Subjects:
Grades:
5th - 7th
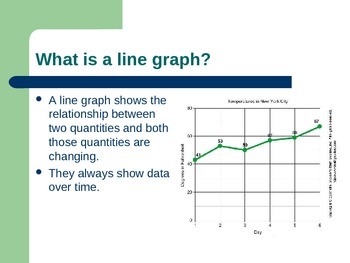
Graphing Powerpoint
This is an introductory PowerPoint graphing. The PowerPoint includes:
-Different types of graphs
-Vocabulary used to construct a graph
-How to construct a line graph
Notes of formatted is such a way that they can easily be used in A.V.I.D. Cornell Note style with the heading being used as the question in the left column and the notes for the right column.
Subjects:
Grades:
5th - 7th

From Ash Wednesday to Easter Sunday
Help students explore their faith and deepen their understanding of the season of Lent. This presentation is great during this holy season since it explores Ash Wednesday, Lent, Holy Week, Easter, and more!This Power Point includes 32 visual appealing slides perfect for religion class or Sunday school. The presentation is filled with colorful visuals and details for children.Informational texts help promote vocabulary development and allows students to use prior knowledge to make connections to
Subjects:
Grades:
4th - 8th
Also included in: Spring Growing Big Bundle (March, April, May)
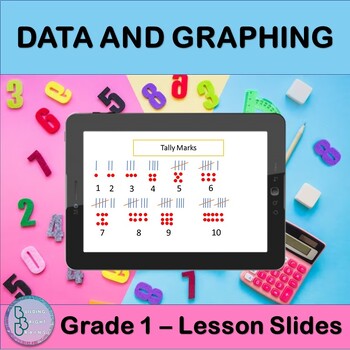
Data and Graphing | PowerPoint Lesson Slides Tally Chart Pictograph Bar Graph
Are you teaching your students about Data and Graphing? This resource is great for you for First Grade! Plenty of examples and application exercises are included. You can also easily convert this to a Google Slides lesson by dragging it into your Google Drive.What is included?✦ 6 total slides for notes, examples and applications.✦ All steps are animated to allow the teacher to explain them gradually. At the end of the lesson, students will be able to ✦ Make a Tally Chart✦ Make a Pictograph✦ Read
Grades:
1st - 2nd
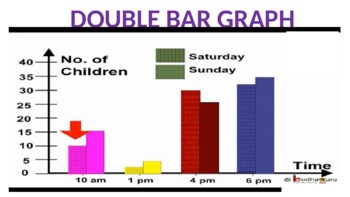
Double Bar Graph Powerpoint
The presentation contains:Learning Objectives.Definition of a double bar graph.Parts of a double bar graph.Difference between bar graph and double bar graph.Tips for construction of double bar graph.Steps to construct double bar graph with an example.To read and interpret the double bar graph.
Subjects:
Grades:
5th - 10th, Staff
Also included in: Data Representation Powerpoint
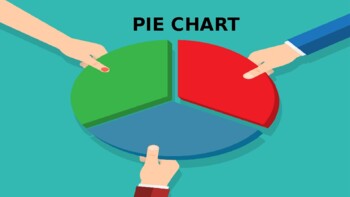
Pie Chart Powerpoint
The presentation contains:Learning Objectives.Definition of a Pie Chart.Tips for construction of pie chart.Steps to construct a pie chart with an example.Scaling and drawing a pie chart.Read and Interpret a pie chart.
Subjects:
Grades:
5th - 10th, Staff
Also included in: Data Representation Powerpoint
Line Graph Powerpoint
The presentation contains:Learning objectives.Definition of a line graph.Parts of a line graph.Tips for construction of line graph.Steps to construct line graph with an example.Reading and Interpreting a line graph.Advantage of line graph.
Subjects:
Grades:
5th - 10th, Staff
Also included in: Data Representation Powerpoint
Lenten Season for Children K-3
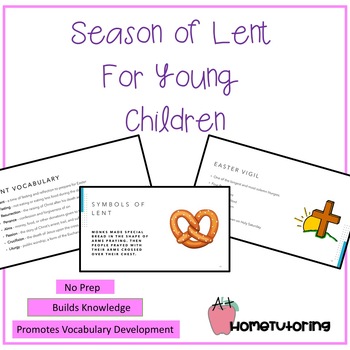
Help students explore their faith and deepen their understanding of the season of Lent. This presentation is great during this holy season since it explores Ash Wednesday, Lent, Palm Sunday, Good Friday, Easter, and more!This Power Point includes 22 visual appealing slides perfect for religion class or Sunday school. The presentation is filled with colorful visuals and details for children.Informational texts help promote vocabulary development and allows students to use prior knowledge to make
Subjects:
Grades:
K - 3rd
Also included in: Spring Growing Big Bundle (March, April, May)
Pascua
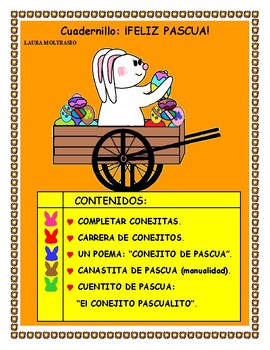
Un cuadernillo sobre Pascua con sencillas actividades para niños desde preescolar hasta tercer grado o incluso cuarto. Puede ser trabajado a nivel individual o grupal. En la carrera de conejitos pueden trabajar en grupos midiendo y comparando los largos. Pueden inventar en el patio con tiza sus propios caminos y caminarlos, midiendo los pasos. Este es un buen trabajo para el concepto de medición y la necesitad de buscar un patrón de medición común como el metro o la yarda. El cuento da la posi
Grades:
PreK - 4th
Types:
Graphing Linear Equations (focus on Real-Life Situations)
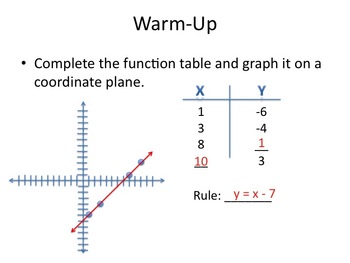
This PowerPoint can be used to introduce students to graphing linear equations. It should be played as a slideshow, where it steps students through linear equations by starting with the basic idea of graphing a function. The presentation ramps up to focusing on real-life situations that might be represented by a function. The show ends by looking at different graphs and asking students to think of a real-world situation that might match the given graph.
Grades:
5th - 8th
CCSS:
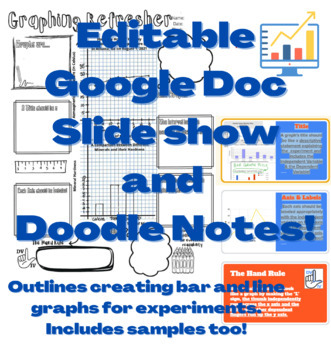
Scientific Graphing EDITABLE Google Slide Show with Keys and Doodle Note Sheet
This Slide Show does a wonderful job outlining key aspects of graphs including: Line and bar graphs, accurate titling, axis, and scaling. The doodle note sheet gives two examples of correct graphs, in addition to encouraging students creativity. It will help your students create their own graphs to represent their data in future experiments from start to finish.
Grades:
5th - 9th
Types:
Showing 1-24 of 69 results


