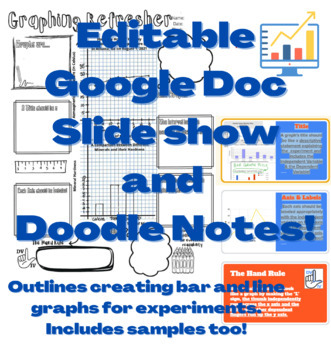
Scientific Graphing EDITABLE Google Slide Show with Keys and Doodle Note Sheet
Thompson's Science Lab
10 Followers

Made for Google Drive™
This resource can be used by students on Google Drive or Google Classroom. To access this resource, you’ll need to allow TPT to add it to your Google Drive. See our FAQ and Privacy Policy for more information.
Description
This Slide Show does a wonderful job outlining key aspects of graphs including: Line and bar graphs, accurate titling, axis, and scaling. The doodle note sheet gives two examples of correct graphs, in addition to encouraging students creativity.
It will help your students create their own graphs to represent their data in future experiments from start to finish.
Total Pages
10 pages
Answer Key
Included
Teaching Duration
55 minutes
Report this resource to TPT
Reported resources will be reviewed by our team. Report this resource to let us know if this resource violates TPT’s content guidelines.


