246 results
Elementary graphing handout microsofts
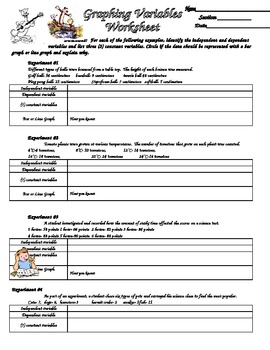
Scientific Method Variables and Graphing Practice
Students are given six different sets of experimental data and asked to identify the variables (independent, dependent etc.). They also reinforce graphing by identifying if the data should be represented with a bar or line graph. With this information, students the create data tables and graphs for the data.
Subjects:
Grades:
3rd - 12th
Types:
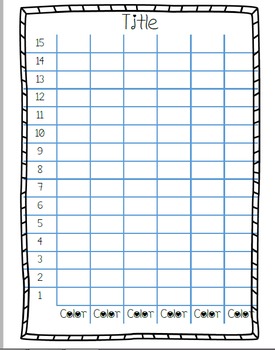
Blank Editable Graphs
These are blank graphs that you can edit by typing in the name of the graph and whatever objects are being graphed. There are bar graphs, a pie graph, and a line graph template.
Subjects:
Grades:
K - 3rd
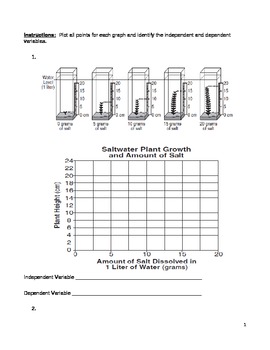
Middle School Math and Science Graphing Practice - Middle School Line Graphs
Use this resource to help your middle school math and science students learn and practice how to make line graphs as well as identify the independent and dependent variables. Move beyond bar graphs! There is a teacher key provided and eight graphs for practice.
line graph, plot points, x-axis, y-axis, independent variable, dependent variable
Subjects:
Grades:
5th - 9th
Types:
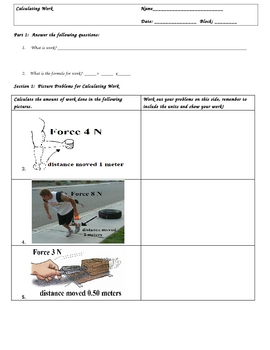
Calculating Work (W=Fxd) Worksheets and Key
Calculating Work (W=Fxd) Worksheets and KeyIf you have been teaching a Simple Machines or Energy Unit, then you need to check out this three page lesson to teach calculating work. It is in three sections.Section 1: Picture QuestionsSection 2: Word Problems/with Challenge QuestionsSection 3: Charting/Graphing ProblemsAll problems are worked out and the key is included.These worksheets include the renown Triangle Method, which has been a proven problem solver for students who struggle in math.The
Subjects:
Grades:
3rd - 12th, Higher Education, Adult Education
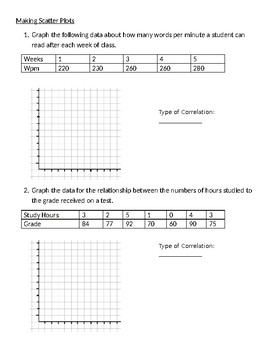
Making Scatter Plots Worksheet
2 pages of practice problems with given information to create scatter plots
Grades:
5th - 12th
Types:
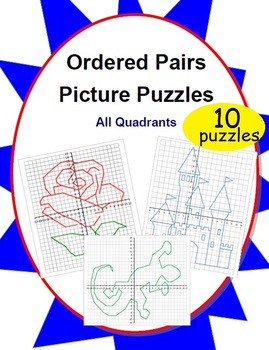
10 Ordered Pairs Mystery Picture Puzzles (All Quadrants)
10 original pictures perfect for any order pair puzzler. Start simple with a continuous connect-the-dot picture and graduate to more complex pictures composed of multiple sections. The built-in self-checking nature of creating a picture makes it easy for students to immediately assess their own progress.This 15-page PDF file includes:- 10 reproduction-ready original picture puzzles- An illustrated key so teachers can select appropriate puzzles based on student skill level and intended use- Numbe
Grades:
4th - 10th
Types:

Pattern Blocks with Angle Measures
This is a student resource quick guide displaying angle measures of pattern blocks. An easy resource to print, laminate and share with your students! This supports New York Common Core Mathematics Grade 4: Module 4, Lessons 10 and 11. In these lessons, students use pattern blocks to create angle measures of 90, 180, 270 and 360 degrees. This resource is also great for Math centers!
Subjects:
Grades:
3rd - 6th
CCSS:
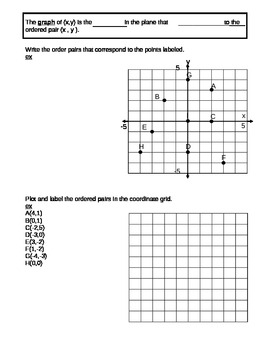
Coordinate Plane
This is a document that is used for guided notes for the Coordinate Plane. The notes practices how to plot points given ordered pairs, how to write the ordered pairs given the graph,and numbering the 4 quadrants.
Grades:
5th - 10th
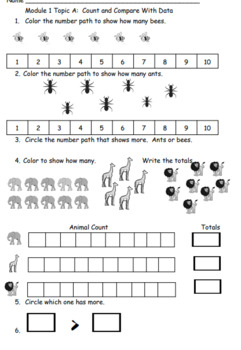
Eureka Math Squared Module 1 Topic A Quiz
This is an end of topic assessment for Eureka Math Squared Topic A: Count and compare with data. Students use graphs to organize, represent, and interpret data. They collect data by counting various things. They use the greater than > and less than < symbols to write comparisons number sentences.
Subjects:
Grades:
1st
Types:
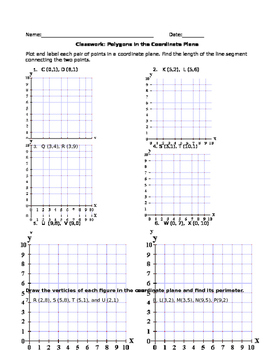
Polygons in the Coordinate Plane Worksheet
This file can be changed as needed, but it is designed to help students with graphing a polygon in quadrant 1 only of the coordinate plane and finding the distance between points
Also check my store for the accompany notes and flipchart (active inspire)
Subjects:
Grades:
5th - 8th
Types:
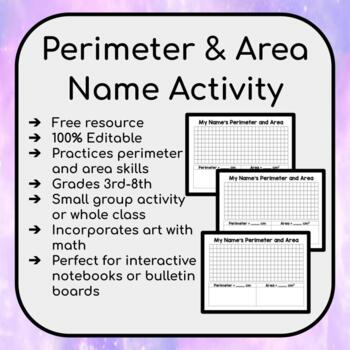
My Name: Perimeter and Area Activity
A fun math craft activity where student show off their area and perimeter skills! Print and go! Pro Tip: Post some examples or show YouTube videos on how to create block letters! I would always do this before starting the lesson :)
Grades:
3rd - 8th
Types:
Presentación Digital: Trabajando con Datos (Gráficas y Análisis de Datos)
¿Estás listo para sumergirte en el fascinante mundo de los datos y aprender a transformarlos en información valiosa? ¡Nuestra completa y atractiva presentación es la herramienta perfecta para ti!¿Qué encontrarás en nuestra presentación?*28 diapositivas ("slides") con información acerca de:Los tipos de gráficas (barra, lineal o puntos, pictográfica, circular).Las partes de una gráfica (ejes, variables, título, leyenda, etc.).Descripción de los tipos de gráficas.Y más...Si tiene algún comentario o
Grades:
4th - 6th
Types:
Also included in: Bundle: Trabajando con Datos (Gráficas y Análisis de Datos)
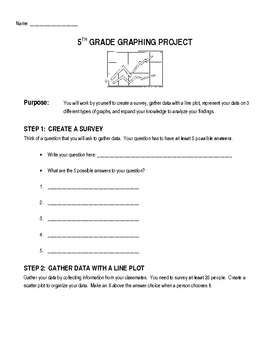
5th Grade Graphing Project
This is a 6-step project with a grading rubric to take students through the steps of collecting data, organizing it into different types of graphs, and interpreting it. Easily adaptable for grades 3-5.
Subjects:
Grades:
3rd - 5th
Types:
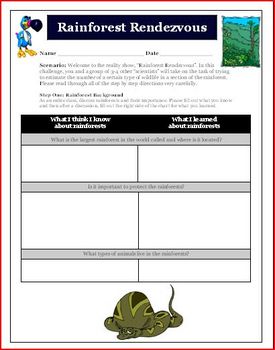
Median and Graphing Math Activity Rainforest Rendezvous
Median and Graphing Math Activity Rainforest Rendezvous. This is a 5page document that will have your students going on a "Rainforest Rendezvous" reality show and sampling colored tiles(animals) and then trading with another group for them to try to determine the number of tiles (green, yellow, red, and blue) in a bag (rainforest).
This 5-page document includes step-by-step directions with tables and a "What do I know about rainforest page" (with key). This activity is meant to be an enjoyable
Grades:
4th - 7th
Types:
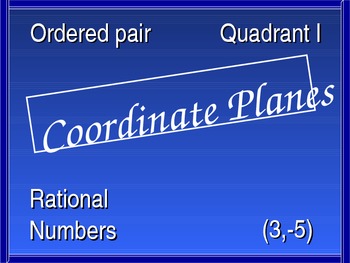
Common Core Standards Geometry, Number Sense, Coordinate Planes Handout
This PowerPoint lesson is very comprehensive and student involvement is significant. The following areas will be covered: understanding the coordinate plane, plotting points, reflection, dilation, integers, absolute value, rational numbers, perimeter, and area. Handouts with answers will support each part of this lesson.
Common Core State Standards are: Geometry 5.G 1 & 2,
6.NS 5-8, and 7.NS 1
Subjects:
Grades:
5th - 7th
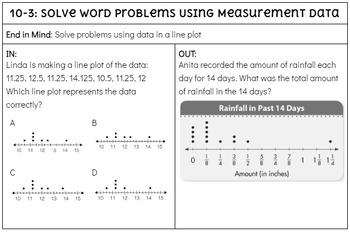
Topic 10 INs and OUTs - Savvas EnVision - 5th Grade - Line Plots (Analyze Data)
This printable document provides and IN and an OUT for each lesson in the topic. It is an easy way to formatively assess whether or not the students understood the lesson concepts. All problems align with Savvas EnVision 5th Grade curriculum. There is also space for notes and the CUBES method for solving word problems included! NOTE: This includes INs and Outs NEW version. In the new version, Topic 10 focuses on Line Plots. The old version focuses on volume. If you are using the old version, I h
Subjects:
Grades:
5th
Types:
CCSS:
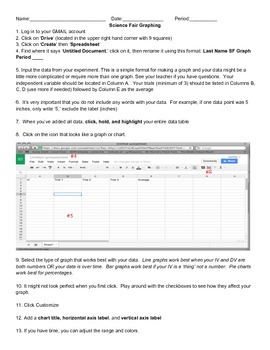
How To Graph Using Google Spreadsheets
This is a step-by-step guide on how to use Google Spreadsheets for students in grades 5-12. Use this as a resource when guiding students through the process. Included with the directions is sample data for students to use when practicing graphing. Perfect for science experiments and science fair!
Subjects:
Grades:
5th - 12th
Types:
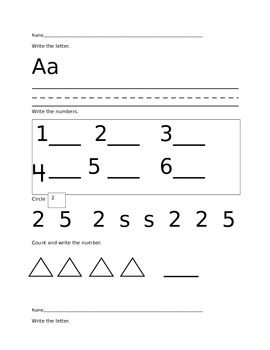
Kindergarten Common Core Test Prep/ Morning Work/ Workshop/ Independent Work
These handouts will reinforce concepts essential for kindergarteners to learn. The student will practice numbers to 100, the alphabet, patterns, telling time, graphs, high frequency words, sentence practice, months of the year, days of the week, solid and flat shapes, measurement, addition, subtraction, and counting objects. These handouts could be used during workshop, as morning or independent work.
Subjects:
Grades:
PreK - 1st
Types:
Coordinate Planes
This can be used as independent practice or whole group instruction. This is great practice for 5th grade math when learning about coordinate planes.
Grades:
5th
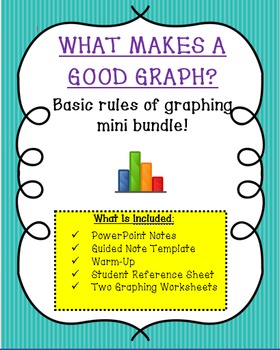
What Makes A Good Graph? Basic Graphing Rules & Practice Mini Bundle
In this mini bundle students will review what makes a good graph. This bundle includes everything you need to review in order to construct a bar and line graph. In addition to creating bar and line graphs, students will have the opportunity to practice graph interpretation not only using bar and line graphs but also pie charts, line plots, and histograms.
The PowerPoint presentation is accompanied with a quick and easy guided note sheet that is color-coded to make the note-taking process ea
Subjects:
Grades:
5th - 7th
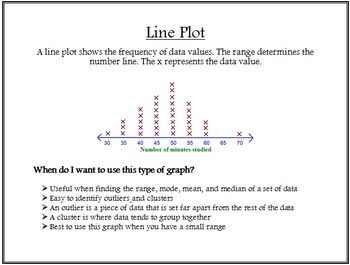
Types of Graphs Posters
Students will explore a variety of different types of graphs and learn about the characteristics and advantageous traits of each type. These posters include the following types of graphs: bar graph, line graph, pictograph, circle graph, line plot, histogram, stem-and-leaf plot, and double line graph. You can display these posters in your classroom for student reference. You can also download my free product named "Types of Graphs Graphic Organizer" and use the posters to help students explore th
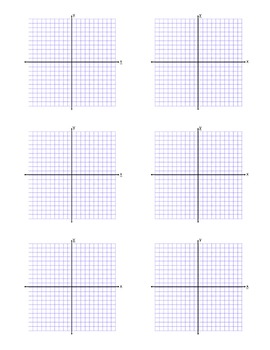
Graph Paper, 12 graphs on 1 sheet
Having a hard time finding the nice, organized graphs for your students to graph lines on? This document has 6 graphs (-10 to 10) on each side of the paper, for a total of 12 nice, easy to read graphs.
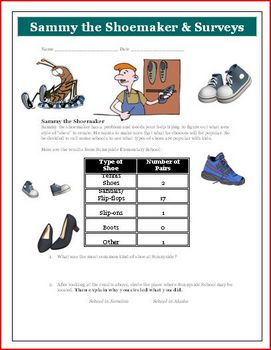
Math Graphing Activity
Math Activity with Graphing and Explaining Data. This is an 8 page document that will have your students looking at shoes and graphing some results. After that, students are asked to create their own survey question, have the class take the survey, graph, and then display the results.
This 8-page document includes discussion sheets, handouts, and a grading rubric. It is meant to be an enjoyable activity for students and a way they can choose their own learning.
Visit our store for more creativ
Subjects:
Grades:
4th - 7th
Types:
Showing 1-24 of 246 results


