177 results
Elementary graphing project microsofts
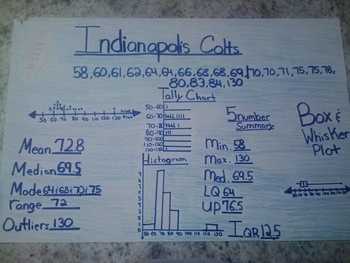
Favorite Sports Team: Data Displays and Measures of Central Tendency Project
Students will create a poster using sports statistics. Depending on the time of year, you may want to use football scores, basketball scores, data from the Olympics, etc. Students will use the internet (or you can print out statistics for them) to find sports data.
The students really buy into this project because it is about something they are interested in - their favorite sports team!
Students will display their knowledge of several data displays: line plot, tally chart, histogram and bo
Subjects:
Grades:
5th - 8th
Types:
3rd Grade Data
3rd Grade Data: This third grade resource on data includes a PowerPoint on four types of data, a small group project using data, a foldable graphic organizer on data, and a quiz on collecting, organizing, displaying and interpreting data for Third Grade TEKS 3.8A and 3.8B: This bundle of resources is closely aligned to the Texas Math Standards TEKS 3.8A and 3.8B. The 30 slide PowerPoint presentation introduces word problems related to everyday life. It includes problems with bar graphs, pict
Subjects:
Grades:
3rd
Paper Airplane 5th Grade Common Core 5.MD.2 Line Plot Performance Task
This task allows students to work in groups to construct a paper airplane, fly it, measure the distance flown, and then create a line plot based on their data. This comes with student friendly instructions, and guiding questions for students to complete following the completion of their line plot. This corresponds with the fifth grade Common Core Math standards for line plots. This could be adjusted to fit fourth grade line plot standards.
Subjects:
Grades:
4th - 5th
Types:
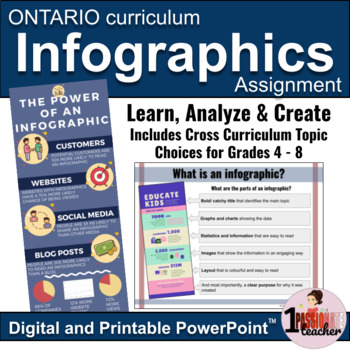
Infographics | New Ontario Math Curriculum 2020 | Editable PowerPoint
Teach your students about the power of using infographics in data management to tell a story about any topic. This lesson, practice and creation activity is as flexible as you need it to be right now. Includes rubrics and multiple curriculum topic suggestions for grades 4, 5, 6, 7 and 8 from Ontario curriculum expectations, including the New Ontario Math Curriculum 2020 and can be used for virtual or in-person learning.And like with all of my products, this resource is completely editable! Perfe
Subjects:
Grades:
4th - 8th
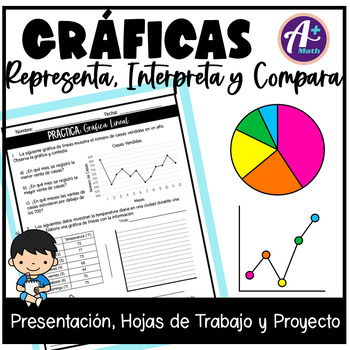
Gráficas - Estadística
Gráficas - Estadística - Analizar DatosEste recurso trabaja los siguientes temas:Gráficas: Representa, Interpreta y Compara•Recopilar y Organizar Datos •Tabla de Frecuencias•Gráfica de Barras•Gráfica Circular•Gráfica Pictórica•Gráfica Lineal•Tabla de Tallo y Hojas•Diagrama de PuntosEl recurso incluye:•Presentación en PowerPoint y PDF - 55 diapositivas con explicaciones y ejemplos•8 hojas de trabajo - Incluye la clave de respuestas•3 hojas de trabajo - Proyecto - Encuesta y analiza los res
Subjects:
Grades:
4th - 6th
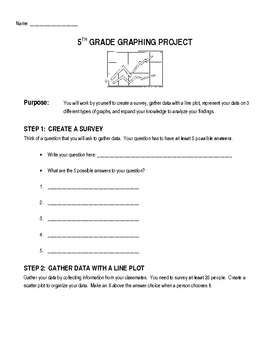
5th Grade Graphing Project
This is a 6-step project with a grading rubric to take students through the steps of collecting data, organizing it into different types of graphs, and interpreting it. Easily adaptable for grades 3-5.
Subjects:
Grades:
3rd - 5th
Types:
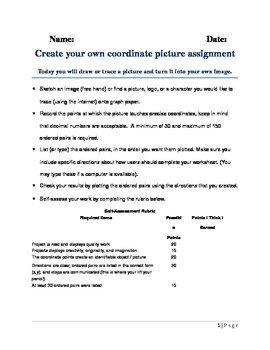
Create your own coordinate plane picture.
The create your own coordinate plane picture project is a 3 or 4 class period assignment where students take a picture or logo and then they use ordered pairs to recreate the picture. This project guides the student through the process of creating, accessing, peer assessing, and finalizing their picture. Three rubrics are included, one for self assessment, peer assessment, and finally teacher assessment. I used this project in my math elective class and students love the differentiation comp
Grades:
4th - 8th
Types:
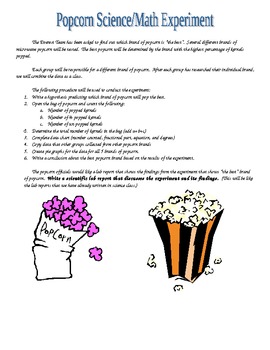
Best Popping Popcorn Experiment Scientific Method
Science/Math interdisciplinary experiment. Students use the scientific method to test the best popping popcorn. They use math skills to collect data, create circle graphs and analyze the results. Students love this because they work together to conduct an experiment and get to eat popcorn when they are done. Rubrics, data tables, brainstorming chart, checklist and analysis worksheets are included in this 5 page file.
Grades:
4th - 12th
Types:
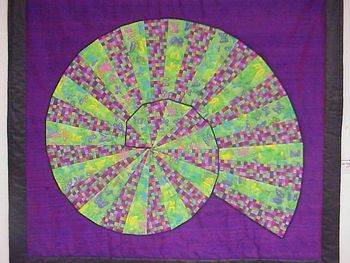
Pythagorean Spiral project.
The Pythagorean spiral project uses the Pythagorean Theorem to create a beautiful spiral if done correctly. This can be used from Pre-Algebra all the way to graduation as a good way to teach the Pythagorean Theorem as well as constructions. Have the student decorate the spiral after to add some flare to their work!
A rubric is included for easy grading.
Grades:
5th - 12th
Types:
CCSS:
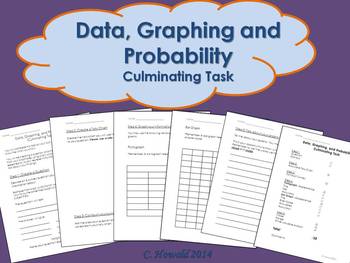
Graphing Unit Culminating Project
I used this activity as a summative assessment for my Data, Graphing and Probability Unit. This gave students the opportunity to create their own question, survey a group of students (visited another class in the school), collect, display and analyze their data.
I have left this as a .doc file so that you are able to adjust it to fit the needs of your classroom.
If you have any questions or concerns, let me know!
Thanks for downloading. Please take the time to rate this product.
If you e
Subjects:
Grades:
2nd - 4th
Types:
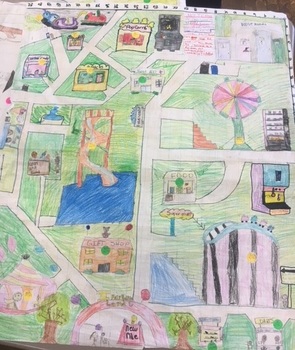
Math Theme Park Project
"Dear Math Teacher,
Maybe your students need a fun project to apply their new math skills, or maybe it is the end of the year and you want to keep them engaged with a creative activity. Either way, get ready to meet your class of theme park designers!
This project requires your students to do three things to demonstrate their skills with geometry, decimals, and business too: 1) create a map for the theme park they’ve created, 2) plan to hire and pay enough workers to run the park, and 3) crea
Subjects:
Grades:
4th - 6th
Types:
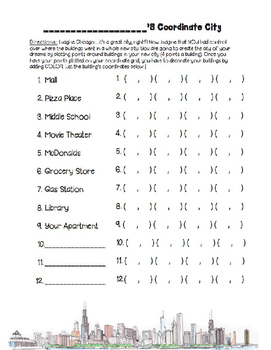
Coordinate Plane City Activity
Students will create their own city by plotting points on a coordinate grid. This activity can be used to practice Geometry skills. Students can practice:
-plotting points in the 4 quadrants
-finding the area and perimeter of shapes
-finding the distance between two points
...and much more!
Subjects:
Grades:
5th - 8th
Types:
CCSS:
Conducting a survey
This assignment is designed to walk students through how to conduct a survey and represent their findings in a bar graph. This ties in closely with the Ontario Math Curriculum for data management. Students come up with their own close ended survey questions, and conduct surveys among their classmates or other classes in the school.
The assignment outlines the steps to conducting a survey, provides a checklist for the students and for evaluation purposes, and a blank bar graph sheet.
Subjects:
Grades:
4th - 6th
Types:
Create a Map Cartography Project
This project ties it all together when it comes to map making! If you're looking for your students to take on the role of a cartographer, then this is the product for you! Students must read the fictitious diary entry of a sailor and use his words and sketches to create a map for the rest of the world. I use this activity as a summative assessment for our unit on early explorers, however, it works perfectly for other subjects like geography, math, and social studies.You can assign this as an i
Subjects:
Grades:
5th - 7th
Types:
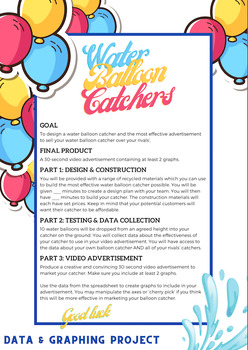
Water Balloon Catcher Project - Data and Graphing - Mathematics
Transform your maths classroom into a dynamic hub of learning with this captivating data and graphing project! Designed for upper primary/middle school students, this hands-on and inquiry-based activity ensures an immersive experience in mastering data interpretation, chart creation, and understanding the role of data and graphs in advertising.In this engaging project, students will: Explore Data: Collaborate in teams to design and construct a Water Balloon Catcher using recycled materials, each
Subjects:
Grades:
5th - 9th
Types:
9 Science Fair Data Graph PowerPoint Lesson with Experiment, Directions & Rubric
Step 9 - Data Graph - Use this PowerPoint to teach the 9th step of the Scientific Process. This lesson includes: Essential Question (Question of the Day), Vocabulary, Examples, Directions, Rubric, and an Experiment to practice making an appropriately labeled data graph. After the lesson and hands-on experiment, students will be guided in setting up their data graph for their own science fair project. When students understand each step of the scientific process from hands-on experience, they can
Subjects:
Grades:
3rd - 6th
Also included in: Complete Science Fair *Growing Bundle*
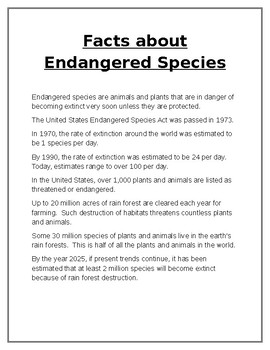
Facts About Endangered Species - Bar Graph and Data Analysis
Complete independent study and activity to bring awareness to endangered species. Students get introduced to the Endangered Species Act, answer questions, create a graph based on data provided, and prepare a PowerPoint presentation on a species of their choice. This is a complete activity where students are engaged and practice their analysis and graphing skills. They take ownership of their work by selecting the subject of their research and presenting their report to the group. This is a ve
Subjects:
Grades:
5th - 8th
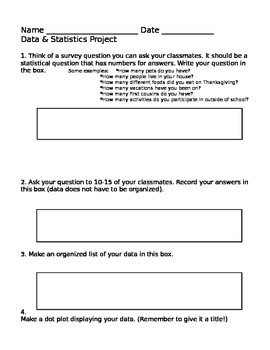
Statistics & Data Survey Project 6.SP
This is a review project to be used at the end of the statistics unit for 6th grade Common Core math (CC.6.SP). Students create their own statistical question and survey classmates. They then use the survey data to create a dot plot, frequency table, histogram, and box & whisker plot. Students must also find the mean, median, mode, range, and mean absolute deviation of the data set. This project connects the statistics unit with real-world questions and brings the concepts to life.
In .doc
Subjects:
Grades:
5th - 7th
Types:
Excel Graphing Summer Fun with Digital Student Directions
The last marking period of the school year can be a challenging time to keep students engaged…they’re thinking about summer…you’re thinking about summer…#embraceitThis Summer Fun Excel project can be a perfect way to:* integrate technology* extend and enrich a math topic of study* introduce students to creating sheets and charts using ExcelProject file includes:* teacher notes/ classroom management suggestions* digital survey, using a Google Form, to collect summer activities data* digital stude
Subjects:
Grades:
3rd - 6th
Types:
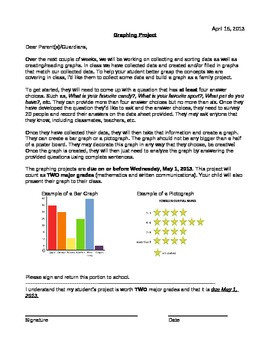
Graphing Project
It allows the students to practice collecting data, analyzing data, and then constructing a graph using the collected data. This can be used for almost all grade levels. The analysis would just need to be enhanced for higher grade levels.
This project is designed as a home project but could also be done in class or in groups. The students develop a question then collect data on their question. From the data collected, a graph is built and analyzed.
This packet includes a letter to go home, th
Subjects:
Grades:
1st - 6th
Types:
End of Year Math Party Planner
End of year project for after assessment. Help keep your class switched on by planning their very own class party for end of year celebrations. This PPT has the main resources on how to introduce the topics. The following are encouraged to include along side this resource. Mini lessons on how to conduct surveys, how to graph results and read tables of information. Mini lessons on how to read time and read timetables. Convert minutes to seconds etc. Mini lessons on money and how to add/ subtract.
Subjects:
Grades:
3rd - 6th
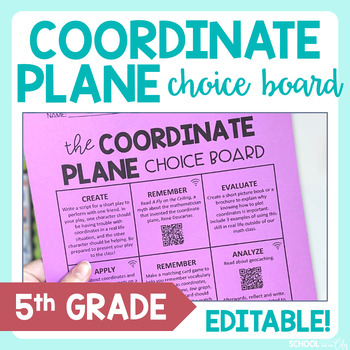
Coordinate Plane 5th Grade Math Choice Board - Editable Extension Activities
Are you looking for an engaging resource to challenge your high-achieving students or to make time meaningful for early finishers? Are you hoping to cater to varying learning styles and free up time for yourself to enrich or remediate? Look no further!WHAT'S INSIDE?This is an editable choice board focused on 5th grade graphing: understanding the coordinate plane and plotting ordered pairs. Activities are based on 5th grade Common Core math standards (5.G.A.1 and 5.G.A.2) but you can edit to fit
Grades:
5th
Types:
6 Editable Bar Graph Templates 2.0
Finally a simple and professional graph space that students can fill out without any design issues getting in the way. This file contains 6 ready-to-use graph options. Print them and have students fill them with pencil and ruler, or distribute them over computer and let them practice entering the data. Get a project perfect finish every time. Maybe you just want to fill it out live on a projector? The possibilities are endless! It's okay to say you love these bar graphs. So do we.Contains:- 2 bl
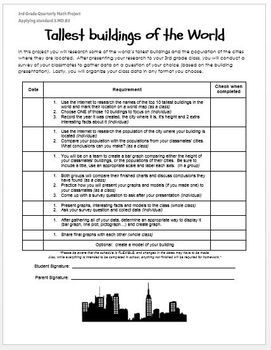
Data and Graphing Enrichment Project - Tallest Buildings
This product is a great project to enhance your students' understanding of the Data and Graphing standards for grade 3. This project is wonderful for your gifted students who have already showed mastery of CCSS MD.B3 and need something to take their learning to the next level.
This multi-faceted project includes research, data analysis, note-taking, bar graph creation, speaking skills (I have students present their buildings to the class), surveys and plotting survey results. I also have an o
Subjects:
Grades:
3rd
Types:
CCSS:
Showing 1-24 of 177 results


