3 results
Statistics simulations for Microsoft Excel

Business Analytics 2nd Edition Sanjiv Jaggia, Alison_SOLUTIONS MANUAL
SOLUTIONS MANUAL for Business Analytics, Communicating with Numbers 2nd Edition by Sanjiv Jaggia Professor, Alison Kelly Professor The download file inludes:Complete Chapters 1-18Compressed zip folder INSTRUCTOR MANUAL ALL CHAPTERSR Code GuidePython Guide and SolutionsExcel Spreadsheets and WorkBookSyllabus Undergrad Business AnalyticsSylabus Business Analytics and Data Mining for BusinessAppendix
Subjects:
Grades:
Higher Education, Adult Education, Staff
Types:

Comparing Linear, Quadratic, Exponential Regressions w/Spreadsheets
This project incorporates spreadsheets with scatter plots and lines of best fit. It asked students to perform various regressions, such as linear, power, exponential, and logarithmic, The students are asked to generate an model to help park rangers determine the weight of black bears by using only one of three measures, neck girth, length, and chest girth. Calculating the bears weights allow the rangers to anesthetize them in order for them to care for the bears. The r values in this project
Subjects:
Grades:
9th - 12th
Types:

Normal Approximation to the Binomial Demonstration
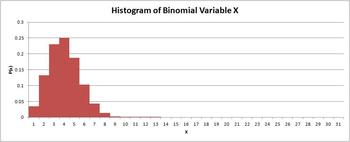
This interactive Excel worksheet uses a histogram to demonstrate to students the conditions under which a normal distribution can be used to approximate binomial probabilities. Users can change the values of n and p, and the histogram will update automatically. The binomial probabilities are also updated with each change. Students will be able to clearly see when the histogram approaches a mounded and symmetric distribution. The bars of the histogram are wide enough for students to be able t
Subjects:
Grades:
9th - 12th, Higher Education
Types:
Showing 1-3 of 3 results


