135 results
Graphing simulations for Microsoft OneDrive
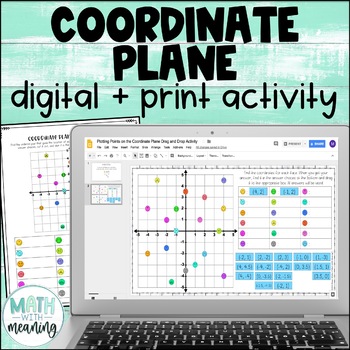
Coordinate Plane Activity - Digital and Print - Plotting Points 4 Quadrants
Looking for a fun way for students to practice using the coordinate plane? Students will practice writing ordered pairs for points on the coordinate plane with this no-prep digital activity! Students will find the ordered pairs for 18 colorful emoji faces on the coordinate plane.The ordered pairs do include decimals (halves only). Please view the preview file to make sure that this activity is appropriate for your students. This product includes the following:A link to the digital activity on Go
Line of Best Fit and Scatterplots
Who doesn't love a good mystery?!!!! In this engaging students use a real life scenario to apply scatterplot data of shoe size and height and the line of best fit to capture the correct suspect. This product has lots of great reviews! Many middle school math teachers state this was a great way to review the concept of line of best fit and scatterplots. Aligned to CCSSM8.SP.A.2 and CCSSM8.SP.A.3This activity is also available in a bundle at a discounted rate:Scatterplots and Line of Best
Subjects:
Grades:
7th - 9th
Types:
Also included in: Line of Best Fit and Scatterplots: The Bundle
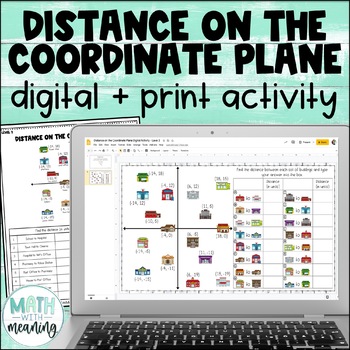
Distance on the Coordinate Plane Digital and Print Activity
Looking for an engaging, no-prep activity to practice finding distance between points on the coordinate plane? Students will find the distance between sets of buildings on a town map with this fun digital and print activity.There are 3 different levels of this activity included:Level 1: Points are shown on a coordinate plane with grid lines and axes go from -5 to 5Level 2: Points are shown on a coordinate plane with no grid lines and axes go from -20 to 20Level 3: Points are not shown on the coo
Subjects:
Grades:
5th - 8th
CCSS:
Also included in: Middle School Math Digital and Print Activity Bundle Volume 3

Exponential Functions Introduction Activity in Digital and Printable
Engage students with this intro lesson that will get them thinking exponentially.Included in download:Would you rather? Choices to get students thinking (PDF and Google Forms Poll included)Table and Graph for students to explore linear vs. exponential results of the given choices (printable PDF, Google Sheets, and Microsoft Excel versions included)Answer KeyExponential functions are a difficult concept for students because they are used to thinking about linear relations. Before telling students
Grades:
8th - 9th
Types:
CCSS:
Also included in: Algebra 1 Discovery Lessons and Inquiry Activities Bundle
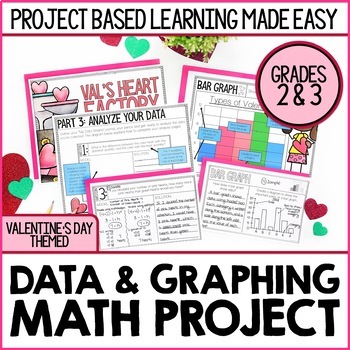
Valentine's Day Math Project | Conversation Hearts Graphing Lesson & Activity
This Valentine's Day-themed math project introduces your students to four methods for displaying data: Frequency TablesBar GraphsPictographsLine Plots Your students will record observations about each method for displaying data and compare/contrast methods for collecting data. Students will then use this knowledge to solve a problem for Val’s Heart Factory. Love this project idea, but planning to teach graphing at a different time of year? Sal's Sweet Factory will be a perfect fit for your class
Subjects:
Grades:
2nd - 3rd
Types:
Coordinate Plane Ordered Pairs DIGITAL Puzzle Pixel Art
#touchdown23Students will write the ordered pair for each dot in this self-checking activity. As the questions are answers correctly, the answers will turn green and parts of the puzzle will appear. This activity includes 12 self-checking problems.If the question is answered incorrectly, the answer will turn red. No puzzle pieces will appear for that answer if it incorrect. This activity is ready to be used as soon as you purchase! As soon as you add it to your Google Drive it is ready to be ass
Grades:
5th - 6th
CCSS:
Also included in: 6th Grade Digital Activities Bundle | Distance Learning
Graphing Linear Equations Digital and Print Activity for Google Drive
Looking for an engaging, no-prep activity to practice matching linear equations to their graphs? Students will match 20 equations to their graphs with this fun digital and print activity. Many of the equations are very similar and involve the same numbers, so students will need to work carefully!All equations are written in slope-intercept form. The graphs include positive, negative, zero, and undefined slopes. Please view the preview file to make sure that this activity is appropriate for your
Grades:
6th - 9th
CCSS:
Also included in: Middle School Math Digital and Print Activity Bundle Volume 2
Rates & Proportional Relationships Real World Project
Students work with real world rate of change and proportional relations as entrepreneurs creating a business startup! They will love getting creative, and you will love that everything is ready to go to get them thinking about math. This project is included in printable PDF version, Google Slides, and PowerPoint.In this project, students get creative as they decide on a type of business, membership fees, and a building location. Then they must calculate their costs and profits based on those dec
Ocean Floor Mapping Battleship Game
Teacher Review: "My students are obsessed with this activity! They even ask to play during indoor recess!" - Turner's Teaching Troop (January 22, 2020)Ocean Floor Mapping Battleship includes 36 unique maps of the ocean floor, a recording sheet, a detailed lesson plan with suggested pre-game activities, a blank map students can use to draw their own ocean floor, a diagram showing the layers of the ocean, and easy to follow game instructions. Field tested with sixth-graders, this game challenges s
Subjects:
Grades:
5th - 9th
Types:
CCSS:
Also included in: Earth Science Games Bundle
Line of Best Fit and Scatterplots: The Bundle
This bundle includes 2 engaging activities where students can apply the skills of plotting points in a scatterplot, making a line of best fit, and finding the slope of the line to find missing data. Fun scenarios of Sasquatch and a crime scene hook kids into learning. Please leave feedback, you can earn TpT credits for future purchases. If you enjoy these activities consider following my store as I work to increase my middle school math inventory. Check out my other middle school math produc
Subjects:
Grades:
7th - 9th
Types:
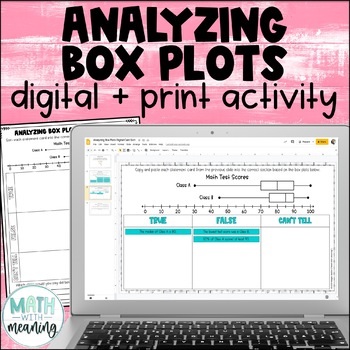
Box and Whisker Plot Digital and Print Card Sort - Reading and Analyzing
Looking for an engaging, no-prep activity to practice reading and analyzing box plots? Students will look at a double box plot and determine if statements about it are true, false, or if they can't tell from the information given in this fun digital and print activity.This activity includes statements about the minimum, maximum, median, quartile 1 (Q1), quartile 3 (Q3), interquartile range (IQR), and range of the box plots, along with statements about the percentages represented by a particular
Subjects:
Grades:
6th - 9th
Also included in: Middle School Math Digital and Print Activity Bundle Volume 3
Ecosystems- Roadrunners and Coyotes NGSS Middle School LS2-1
Turn your students into an active ecosystem. This activity is similar to the classic Oh Deer simulation with a roadrunner and coyote twist. This sequence of NGSS aligned activities/assessments includes two simulation activities in which students are in the roles of a population of roadrunners, a predator (coyote), and resources (food, water, shelter). Students collect, graph, and analyze data to look for cause and effect relationships in an ecosystem. Reading and writing pages are included along
Subjects:
Grades:
5th - 7th
Types:
NGSS:
MS-LS2-1
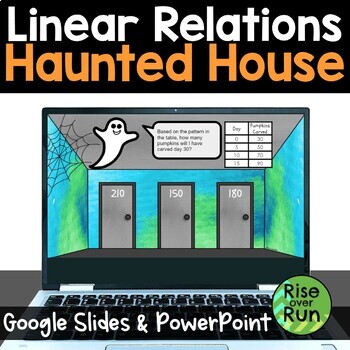
Digital Linear Relationships Halloween Escape Room Activity
Students will love this engaging practice activity for linear relationships. They must try to escape a haunted house! Includes Google Slides and PowerPoint versions. They are given 14 problems to solve, choosing from 3 possible answers for each one. If they solve correctly, they will choose the correct door and avoid the scary giant spiders! If they make a mistake, a spider appears, and they are prompted to try again. Problems include linear graphs, table of values, equations, and stories. Thi
Grades:
7th - 9th
Types:
CCSS:
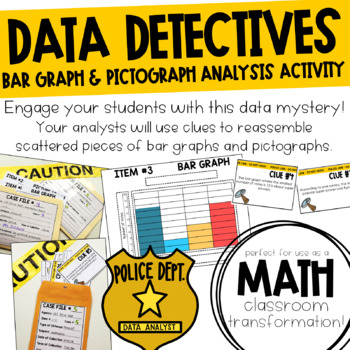
Data Detectives Bar Graph & Pictograph Mystery Activity
Engage your students with this data mystery! You left data in the classroom overnight and someone snuck in and completely scattered it. Oh no! In this activity, your students are data analysts who will use clues to reassemble the scattered pieces of bar graphs and pictographs.This product includes...4 graph starters for your students to complete (2 bar graphs, 2 pictographs)18 pieces (including some decoys) of graphs for your students to analyze and match to a graph starter8 cluesAND everything
Subjects:
Grades:
3rd - 4th
Types:
CCSS:
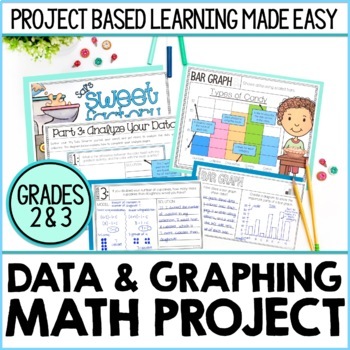
2nd & 3rd Grade Data and Graphing Math Project | Bar Graphs, Line Plots & More
This graphing math project introduces your students to four methods for displaying data: ★ Frequency Tables ★ Bar Graphs ★ Pictographs ★ Line Plots ★Your students will have the opportunity to record observations about each method for displaying data and compare/contrast methods for collecting data. They will then use this knowledge to solve a problem for Sal’s Sweet Factory. ***************************************************************************THE BIG PROBLEM YOUR STUDENTS WILL SOLVE:Sal's
Subjects:
Grades:
2nd - 3rd
Types:
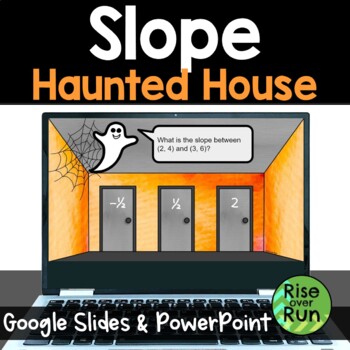
Slope Digital Math Escape Room Activity for Halloween
Students will love this fun practice activity for calculating slope between 2 points. Answering correctly will help them escape a haunted house! Includes Google Slides and PowerPoint versions. They are given 14 problems to solve, choosing from 3 possible answers for each one. If they solve correctly, they will choose the correct door and avoid the scary giant spiders! If they make a mistake, a spider appears, and they are prompted to try again. For each problem, students are given two ordere
Grades:
7th - 9th
Types:
Digital Notebook BUNDLE (VA 6.1, 6.2, 6.3. 6.4, 6.5, 6.6, 6.8)
Get this BUNDLE and save 15%! Includes: SOL 6.1, 6.2, 6.3, 6.4, 6.6a, 6.6b, 6.6c, 6.5abc, and 6.8. Aligned specifically for Virginia teachers, this covers the first semester (most counties). Distance education, 1:1, and works with both Google Slides(TM) and Microsoft OneDrive (TM). This resource was created especially for Virginia teachers and aligns with SOLs 6.1, 6.2, 6.3, 6.4, 6.5, 6.6, and 6.8. A 14-page instructional "how-to" is provided with pictures that explains how to upload, assign,
Subjects:
Grades:
6th
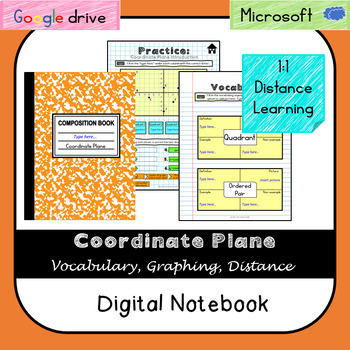
Coordinate Plane Digital Notebook (VA SOL 6.8) Distance Learning- Videos
Distance education, 1:1, and works with both Google Slides(TM) and Microsoft OneDrive (TM). This resource was created especially for Virginia teachers and aligns with SOL 6.8ab. Students will learn about vocabulary of the coordinate plane, how to graph and identify points on the coordinate plane, the difference between vertical/horizontal lines, and distance on the coordinate plane. A 14-page instructional "how-to" is provided with pictures that explains how to upload, assign, and grade this dig
Grades:
6th
Also included in: Digital Notebook BUNDLE (VA 6.1, 6.2, 6.3. 6.4, 6.5, 6.6, 6.8)
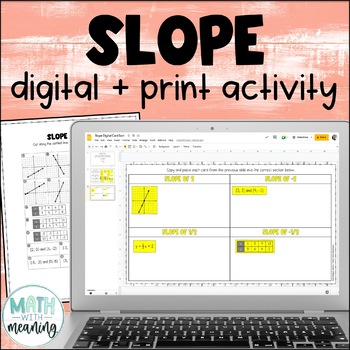
Finding Slope from Graphs, Tables, Equations, and Points Digital Card Sort
Looking for an engaging, no-prep activity to practice finding the slope when given a graph, equation, table, or two points? Students will sort 22 cards based on their slope in this fun digital and print card sort activity.Each problem gives either a table, a graph, two points, or an equation in slope-intercept form and asks students to find the slope. Please view the preview file to make sure that this resource is appropriate for your students.This product includes the following:A link to the ac
Grades:
6th - 9th
Also included in: Middle School Math Digital and Print Activity Bundle Volume 3
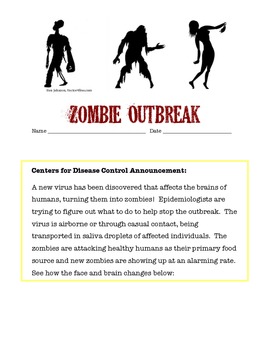
Investigating the Spread of a Viral Outbreak
Students in grades 5 - 9 model the spread of an infectious disease under the entertaining theme of a zombie outbreak. One student unknowingly is patient zero and students simulate the spread of an airborne illness. This highly engaging activity covers health topics, nature of science, and math skills as students graph data in a line plot. Higher level students can be challenged to find the function of the exponential growth of the outbreak.
Subjects:
Grades:
6th - 9th
Decimals Project based learning Monster Ice Cream Parlor
Welcome to The Monster Ice Cream Parlor Decimal focused project-based learning! In this student-tested and approved project, students jump into ownership of the monster ice cream parlor. They create flavors, set prices, and graph their sales all while practicing adding, subtracting and multiplying decimals, and graphing. Included in this ready to use project:- Student pages for building a monster ice cream parlor- Student pages for calculating revenue- Student pages for graphing revenue and s
Subjects:
Grades:
4th - 6th
Types:
Also included in: 6th grade math MEGA resource bundle

Stock Market Simulation Challenge I Digital Learning
What better way to understand how the stock market works than to simulate it in your classroom? To make it a competitive project! This simulation contains the project worksheets, hyperlinks, research guides, and graphs needed for your students to "purchase" their own stock and track it's value over time. This project was written to accompany Gary Paulsen's book "Lawn Boy," but it can be used with or without this book.These activities are suitable for upper-elementary and middle grade students
Subjects:
Grades:
5th - 7th
Types:
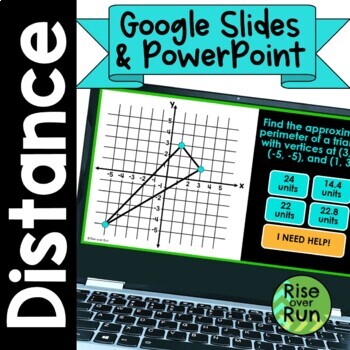
Distance Between 2 Points Practice PowerPoint & Google Slides
Students use the Pythagorean Theorem to find distances between points on a coordinate grid in this no-prep, self-checking activity. Four types of problems are included:Distance between 2 points on a graphDistance between 2 points sketched (for large numbers)Perimeter of polygons on a graphReal world map application problemsSolutions are in the format of whole numbers, decimals, roots, and rounded approximations. Problems range from very basic to challenging!16 problems are included. Each one is
Grades:
8th - 10th
Types:
Also included in: 8th Grade Geometry Unit Activities and Lessons
Scatterplots and Line of Best Fit
This engaging activity allows students to apply their knowledge of slope, scatterplot data, and line of best fit to figure out how tall Sasquatch is. Taking the role of engineers, students use a foot print of sasquatch to approximate his height which is needed to construct a trap. An engaging newspaper article sets the scene of the recent Sasquatch sightings at the local park. This activity is also available in a bundle at a discounted rate:Scatterplots and Line of Best Fit BundleAligned to C
Subjects:
Grades:
7th - 9th
Types:
Also included in: Line of Best Fit and Scatterplots: The Bundle
Showing 1-24 of 135 results


