34 results
Thanksgiving graphing research for Microsoft Word
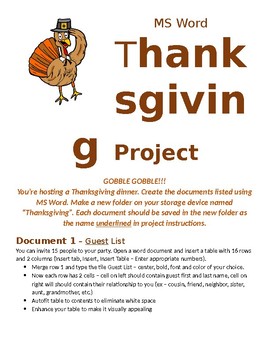
Thanksgiving Project, MS Word
It's a PARTY! Students create 5 documents in MS Word to accompany the Thanksgiving-themed party they will HOST. Students will use table formatting to create a guest list and a template to create a menu. They will also research recipes and activities to include in the party fun. Lastly, students will create an invitation to send to guests. This project encourages creativity - for students are given much freedom in choosing the various aspects. Each year I look forward to watching my students' ima
Grades:
5th - 12th
Types:
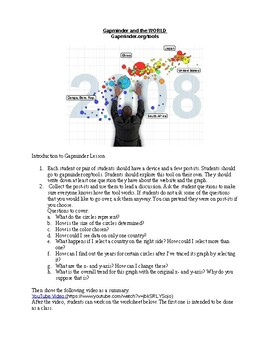
Gapminder and the World Activity
Students use gapminder.org/tools to discover the relationships between various historical factors and the population of many countries over time. This lesson connects history with linear relationships. It is a great way to add context to graphs and help students apply their math knowledge in a unique cross-content way.
Subjects:
Grades:
8th - 12th
Types:
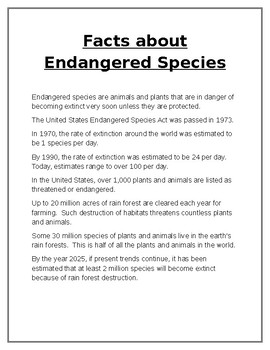
Facts About Endangered Species - Bar Graph and Data Analysis
Complete independent study and activity to bring awareness to endangered species. Students get introduced to the Endangered Species Act, answer questions, create a graph based on data provided, and prepare a PowerPoint presentation on a species of their choice. This is a complete activity where students are engaged and practice their analysis and graphing skills. They take ownership of their work by selecting the subject of their research and presenting their report to the group. This is a ve
Subjects:
Grades:
5th - 8th
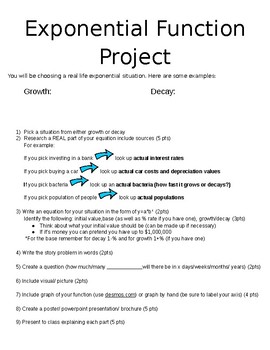
Exponential Function Real Life Project
Students pick an exponential growth or decay situation and research real life rates or values. Furthermore, they create an equation, write a story problem, ask and answer a question, create a graph and present a powerpoint or poster about their exponential situation.
* Note blank space under growth and decay is meant for a whole class brainstorm about the different scenarios they can think of.
Subjects:
Grades:
8th - 12th
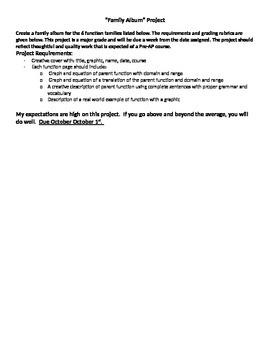
Family Album Project
A project designed to summarize the transformations, characteristics, and domain and range of the parent functions. Allows students to be creative.
Subjects:
Grades:
9th - 12th
Types:
6 Editable Bar Graph Templates 2.0
Finally a simple and professional graph space that students can fill out without any design issues getting in the way. This file contains 6 ready-to-use graph options. Print them and have students fill them with pencil and ruler, or distribute them over computer and let them practice entering the data. Get a project perfect finish every time. Maybe you just want to fill it out live on a projector? The possibilities are endless! It's okay to say you love these bar graphs. So do we.Contains:- 2 bl
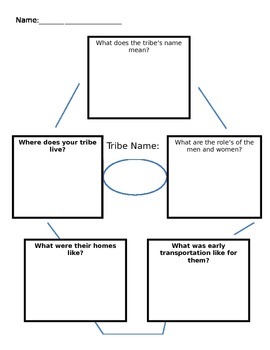
Native American Tribe Graphic Organizer
This graphic organizer is super helpful to students as the research a Native American tribe of their choice!
Subjects:
Grades:
2nd - 4th
Types:
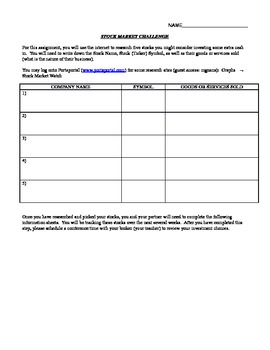
Stock Market Challenge Information Sheet
This document provides students a place to record the information they have gathered from their Stock Market research. It includes a place for students to record their stocks' 52-week high and low, dividends paid, does the company produce goods or provide services, as well as the reasoning as to why your student chose to purchase that particular stock. There are enough recording sheets for 5 stocks. This is a great way to teach students how to record and organize information for later use. If
Subjects:
Grades:
4th - 7th
Types:

Data Collection Project
This project has student generate a question to survey, survey a large group of people, collect the data, create graphs, and analyze that data. Student can create their graph by hand or using Excel. This is a great way to end a unit on graphs.
Subjects:
Grades:
4th - 5th
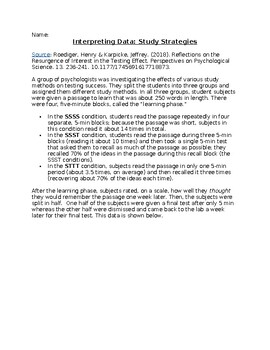
Teach study skills through graphical analysis
Have your students come to their own conclusions about the benefits of retesting over rereading by having them analyze this graph from a 2018 psychology paper. They can practice identifying variables while they compare results, interpret error bars, and apply it to their own study methods.
Subjects:
Grades:
7th - 12th
Types:
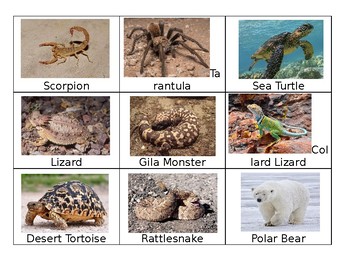
Desert Animals Vs. Non Desert
Use this document to learn about animals of the sonoran desert and compare them to animals that do not live in the desert.
Subjects:
Grades:
PreK - 4th
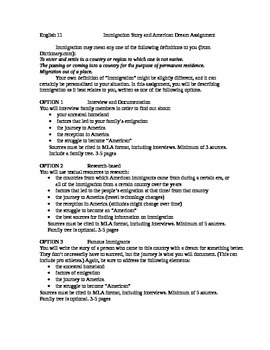
Immigration and American Dream Story
As part of the American Dream unit, teachers at my school had students write about family history. I saw a problem after my first year, however, since some students either didn't know family history. It seemed unfair to tell them that their American experiences were not as important as their classmates, so I added four more options to the assignment.
This download gives you all five options. It was used in an English setting, but it might even be a better paper in social studies. Maybe world l
Grades:
8th - 12th
Types:
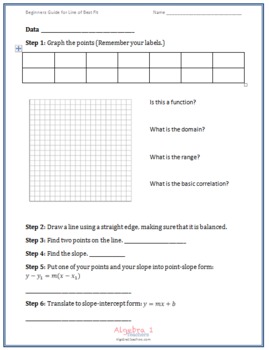
Beginners Guide to the Line of Best Fit
This is a simple one page template, that allows to students (or you) to
-insert data
-graph
-find the slope
-write the equation in point slope form
-convert the equation to slope intercept form
I hope this helps your students write the line of best fit using real world data.
Thank you in advance for your feedback. It is appreciated!
Jeanette Stein
http://algebra1teachers.com
Subjects:
Grades:
8th - 10th
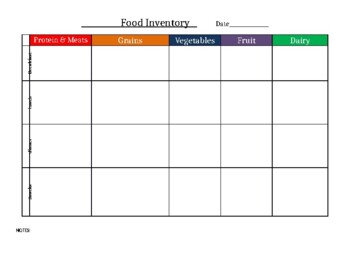
Food Inventory Daily Food and Nutrition Chart/Tracker
Food Inventory Daily Food and Nutrition Chart/TrackerSee preview for setup!
Subjects:
Grades:
PreK - 12th
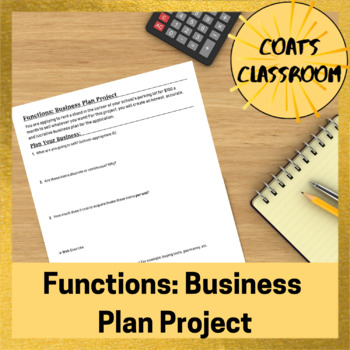
Functions Business Plan Project - Editable
A fun application project to connect writing functions to the real world! Students will create a business plan to sell items from a rented stand. They will consider prices per unit, selling price, upfront costs, rent, and more. Students will write a function that encompasses all costs, then find the point where they break even and create a graph. Rubric is included, along with a feedback worksheet for students to complete while their classmates are presenting. Check out the preview for a full vi

Olympics
I wanted to create a fun unit for my students, but make it educational also. In this unit there are 30 countries that the students can choose from and then a research page for them to fill out about the country they chose. I then created a facebook fake page worksheet for them to fill out and allow them to follow the country they have throughout the Olympic games. I have left further instructions in the packet. I also included a tally chart for them to keep track of the medals their country
Subjects:
Grades:
3rd - 6th
Types:

Real-world Word Problems with Graphing and Time: A Family Outing
There are 5 days worth of lessons using horizontal bar graphs, vertical bar graphs, and picture graphs. Each lesson uses the same flier with information of real places in Phoenix, Arizona to visit on a weekend. Students are to collect the data and answer the questions based on their personal family information. Students need to both collect data to create graphs and read them to answer questions.Each lesson also has a few word problems regarding time. Students need to identify what method of ope
Subjects:
Grades:
3rd - 4th
Types:
Thanksgiving and November Activities for Upper Elementary
Several engaging activities that will keep students happy and busy while learning.
Multiple Choice questions about the month of November and Thanksgiving.
True or False Questions about Thanksgiving. Students can research these using printed material or technology resources.
Wordsearch pages for November and Thanksgiving.
Fall coloring pages, bookmark page to color, bookmarks to print in color.
Crack the Code page to find a Thanksgiving saying.
Answer key included.
Subjects:
Grades:
3rd - 5th

Wampanoag Research
This is a packet designed for students to use and complete to research the Wampanoag tribe. It focuses on the tribe in the past. It is designed for my 2nd grade students. I use this at Thanksgiving. Includes some resources for researching and a writing prompt. I use regular handwriting paper and did not include a writing frame.
Grades:
1st - 3rd
Types:

Common Core Lesson Plans for Thanksgiving
This set of lesson plans will use an informational text (The Pilgrim's First Thanksgiving by Ann McGovern) and a literature text (A Turkey for Thanksgiving by Eve Bunting) to make learning fun and exciting at Thanksgiving time! Turn and talk activities, opportunities for research, writing, and cooperative learning are all included. Many of the common core standards are taught.
Subjects:
Grades:
1st
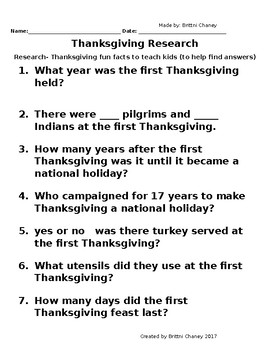
Thanksgiving research packet
Fun and informational thanksgiving research packet. This will give your students to complete some research on their own or in groups. Guaranteed to help your students learn more about thanksgiving and the traditions and history that go along with it.
Grades:
1st - 6th
Types:
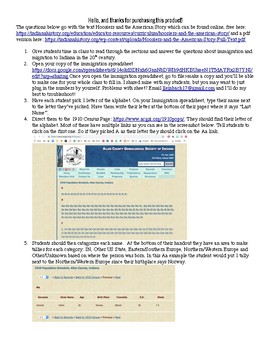
Immigration and Migration in IN | Indiana Studies | Indiana History
Students will read, answer questions and create charts from census data to learn about immigration and migration patterns in Indiana in the 20th century. StandardsIS.1.9 Explain key ideas, movements, and inventions and summarize their impact on rural and urban communities throughout Indiana. IS.1.10 Summarize the impact immigration had on social movements of the era including the contributions specific individuals and groups.Complete Indiana Studies Bundle: https://www.teacherspayteachers.com/Pr
Grades:
9th - 12th
Also included in: Indiana Studies Complete Bundle
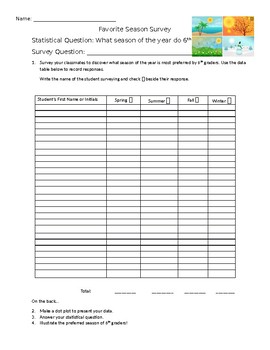
What is your favorite season? Practicing Statistics Class Survey
Students will practice the steps of statistics - gathering data, organizing data, analyzing data, interpreting and presenting data. Students will survey their classmates using the survey question, What is your favorite season? Students will practice statistical questions, data tables, dot plots and illustrations.
Subjects:
Grades:
5th - 8th
Types:
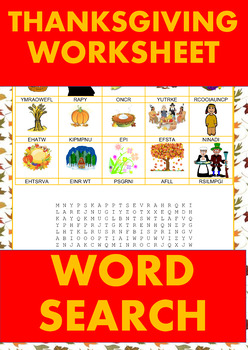
wordsearch thanksgiving wordsearches
Use these fun and easy WORD SEARCH for the beginning artists in your class! Use at station rotations, centers, for early finishers for thanksgiving celebrations you looking for engaging thanksgiving ? This wordsearch is for you
Grades:
Not Grade Specific
Types:
Showing 1-24 of 34 results


