782 results
8th grade graphing activities for Microsoft Word

Beaker Pong: Experimental Design and Graphing Lab, NGSS aligned
Great 1st week or 1st month STEM activity! All parts are EDITABLE and includes a graphing grid! This is a great way to introduce the "science process" (better phrase for scientific method) at the start of a semester or anytime you want fun to occur in your classroom.*****Focus on the NGSS PRACTICES Dimension*****The National Research Council's (NRC) Framework describes a vision of what it means to be proficient in science; it rests on a view of science as both a body of knowledge and an evidenc
Subjects:
Grades:
7th - 12th
Types:
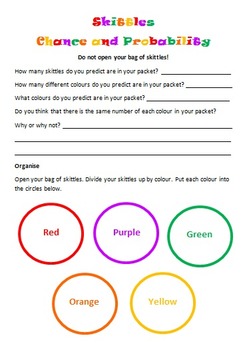
Skittles Chance and Probability (Editable)
Chance and Probability activity using yummy Skittles!!!
Students are to predict the colours and quantities before they open the skittles bag. Students are to complete a chance experiment where they use a tally to collect their data. Students then transfer their data in fractions, decimals and percentages. Students are to create a bar graph using their data as well as answer chance and probability questions about the data. I used this with my grade 5/6 students and they loved it!
Subjects:
Grades:
3rd - 10th
Types:
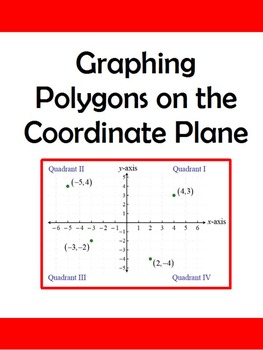
Graphing Polygons on the Coordinate Plane to Find Area/Perimeter
This activity asks the students to plot various ordered pairs on a coordinate plane and connect the points to make a polygon. Then they are expected to calculate the area and/or perimeter of each shape. The first worksheet has a square, two rectangles and a triangle. The triangle is starred to show higher level thinking. Each polygon is to be colored a different color. The second worksheet asks the students to plot the points of five polygons: a triangle, two rectangles and two composite f
Blank Bar Graph/Double Bar Graph Template
This is a bar graph template that can be used by teachers to teach students how to understand bar graphs and create their own bar graphs. Teachers can use this template teach students about parts of a bar graph and how to interpret data in bar graphs.
Grades:
1st - 12th
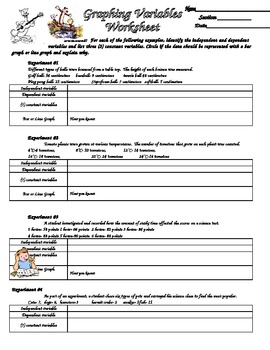
Scientific Method Variables and Graphing Practice
Students are given six different sets of experimental data and asked to identify the variables (independent, dependent etc.). They also reinforce graphing by identifying if the data should be represented with a bar or line graph. With this information, students the create data tables and graphs for the data.
Subjects:
Grades:
3rd - 12th
Types:
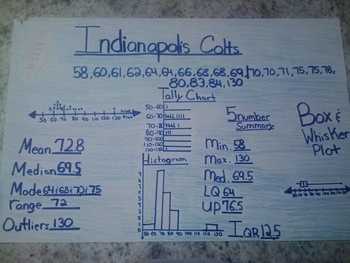
Favorite Sports Team: Data Displays and Measures of Central Tendency Project
Students will create a poster using sports statistics. Depending on the time of year, you may want to use football scores, basketball scores, data from the Olympics, etc. Students will use the internet (or you can print out statistics for them) to find sports data.
The students really buy into this project because it is about something they are interested in - their favorite sports team!
Students will display their knowledge of several data displays: line plot, tally chart, histogram and bo
Subjects:
Grades:
5th - 8th
Types:
Create Population Pyramids!
OverviewStudents will understand how to read a population pyramid by creating one! This activity includes two templates to help your students create their own population pyramids, as well as population data for four countries from the U.S. Census Bureau's International Database. The activity includes blank cards if you or your students would like to create additional or specific population pyramids. Instructions are included to help navigate the U.S. Census Bureau's website in order to obtain th
Grades:
6th - 12th
Types:
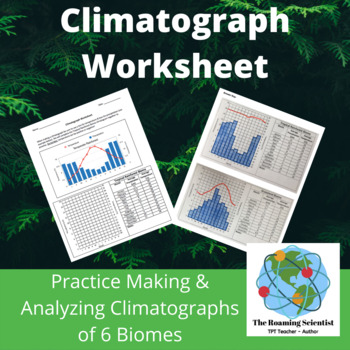
Printable Climatograph Worksheet
This comparative biome graphing worksheet asks students to create and analyze six climatographs for six of Earth’s major terrestrial biomes. Help your students develop graphing skills including drawing bar graphs, line graphs, dual y-axis graphs and interpreting data.This climatograph activity can be used as a lesson, homework assignment, it can be used in small groups or individually or as a revision activity. This is also an excellent substitute teacher lesson. This activity is easily modifiab
Subjects:
Grades:
6th - 12th
Types:
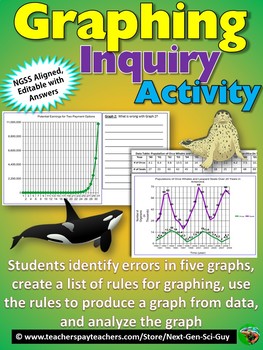
Graphing Inquiry Activity: NGSS Graphing and Data Analysis: Distance Learning
This activity proceeds as follows:1. Students are given a hypothetical scenario in which they are offered two different payment options for house-sitting a wealthy neighbor's house, and have to fill in a data table by calculating the earnings for each option 2. Students then evaluate five different graphs, each of which incorrectly represents the data in some way. They must find the mistakes.3. Students then generate a list of rules for proper graphing4. Students use their rules, and data on or
Grades:
7th - 12th
Types:
Terminal Speed Physics Lab & Graphing Activity using Coffee Filters {EDITABLE}
Do you want a teach your students about terminal speed, but can't find the time to put together a complex lab and then mark it all?
This is the lab for you!
This is part of my cost-saving, amazing Physics Bundle!
This is a quick lab that your students can complete start to finish in one class period. The student handout pages include:
• Purpose
• Question
• Rationale
• Materials
• Procedure
• Observation Table
• Graphing and Follow-up Questions + Conclusion
You'll need:
• meter stick
• coff
Grades:
7th - 12th
Types:
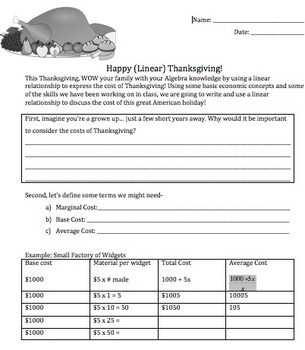
Thanksgiving Math: Linear Equation Thanksgiving Dinner Project for Algebra 1
Harnessing the energy my students come in with right before break, I have created a one-period project in which they are going to create a linear equation related to a Thanksgiving meal. It is sometimes hard for students to create their own equations, but I am hoping that this scaffolded project will be something we can reference for the rest of our linear equations unit!The assignment sheet takes students through some quick new vocab related to economics (definitions included) and provides a ba
Subjects:
Grades:
7th - 10th
Types:
CCSS:
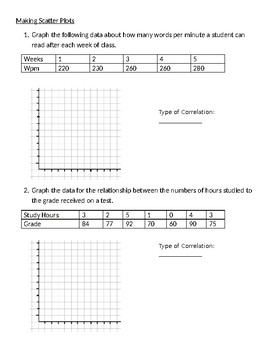
Making Scatter Plots Worksheet
2 pages of practice problems with given information to create scatter plots
Grades:
5th - 12th
Types:
Interpreting Graphs and Charts
Students work with a variety of 25 graphs and charts and learn how to interpret the information provided. The format varies from one to the other: pie, column bar, horizontal bar, line/dot, and picture (volcano) graphs and table charts. Appropriate for math, Social Studies, ELA, ESL, and Spanish culture. Can be used in Gr. 6-12, adult education, college, and home school. All answer keys provided.
Grades:
6th - 11th, Higher Education, Adult Education
Types:
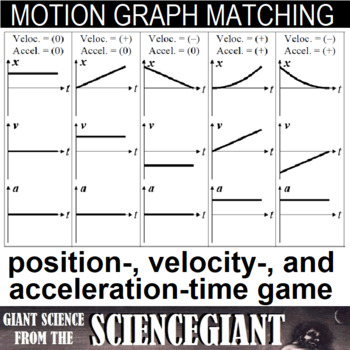
Kinematics Motion Graph Matching Card Game
Motion Graph Matching Card GameMake a game of reviewing motion graphs, and challenge students to find all four matching sets of position-, velocity-, and acceleration-time graph cards and data descriptions. The product contains 28 cards – seven sets of four different card types. Each set covers a motion example and the associated motion graph for an object moving along a straight line in one dimension with its basic shape and slopes. HOW TO PLAY: Cards are placed face down. Students randomly sel
Subjects:
Grades:
7th - 12th
Types:
Also included in: StayGiant Physics Bundle: Kinematics
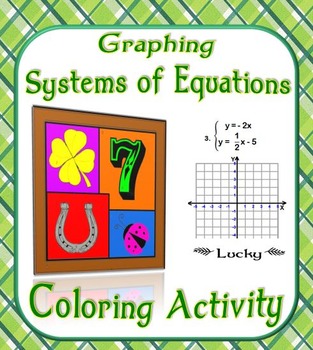
Graphing Systems of Equations Coloring Activity
This is a set of 9 systems problems that asks students to graph in both standard and slope-intercept form to find x and y. The set contains large coordinate graphs to help students graph more accurately. Students solve the problem, find the answer in the picture, and color it based upon a given table of colors.
Graphing Systems of Equations Coloring Activity by Suzie's Angle is licensed under a Creative Commons Attribution-NonCommercial-NoDerivatives 4.0 International License
Grades:
8th - 11th
Types:
CCSS:
ACT ASPIRE - Test Prep - Practice - Reading Graphs/Data Interpretation Exemplar
Students will read a short passage and use different types of tables and graphs to answer questions. A great resource for AMI day. Distance Learning. Keywords- ACT, ACT ASPIRE, SCIENCE, GRAPHS, ACT Aspire like questions, Test Prep
Subjects:
Grades:
3rd - 9th
Types:
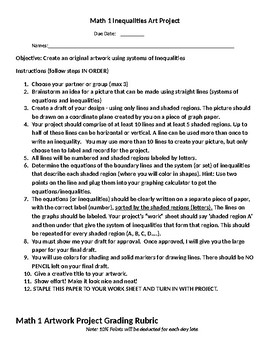
Algebra 1 Systems of Linear Inequalities Art Project
This project allows students to practice graphing systems of linear inequalities to create a picture made up of shaded areas. Includeds detailed directions and a grading rubric. I provided my students with graph paper to do their draft on, then large poster size grid paper to do their final project. Students worked in groups of 2 to 4.
Subjects:
Grades:
8th - 11th
Types:
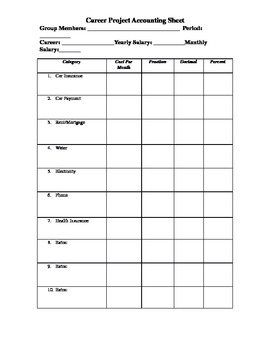
Career Monthly Bils Circle Graph Project
In this project students draw a career and select 10 of their monthly bills. They then figure what percent of their monthly salary goes to each item and create a circle graph showing where their money goes. The file you will receive includes a rubric for the project, an accountability sheet, 24 "career cards", a list of choices for the 7 required and 3 choice items in the project, and teachers notes about how the project has been made successful in their class. It is a word document so any of th
Subjects:
Grades:
6th - 8th
Types:
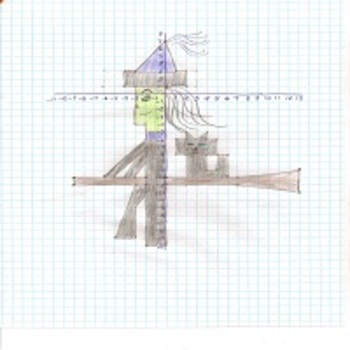
Halloween Designs: Creating Mystery Pictures With Coordinate Geometry
Students will create Halloween designs with this coordinate geometry activity. Have students create their own designs on a coordinate grid, using a Halloween theme. Students will practice plotting points, identifying coordinates on a grid, labeling a coordinate grid etc. I have included:-2 Student printable sheets (one asks students to create a basic design; the second also requires students to translate, rotate or reflect the design)-5 mystery Halloween designs that my students have created -th
Subjects:
Grades:
6th - 8th
Types:
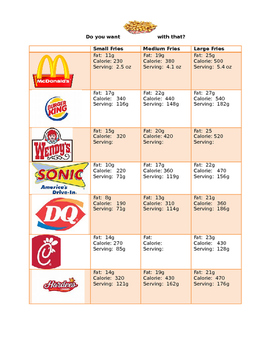
French Fry Scatter Plot & Best Line of Fit
Students will compare the nutritional values and serving sizes of french fries from various fast food restaurants. Based on this information, they will create scatter plots, best lines of fit and the equation of the trend line. Using the equation, they will estimate the unknown values of kid meals and supersized portions of french fries.
Subjects:
Grades:
8th - 11th
Types:

Next Generation Science Lab: How Gross is your Phone? A Bacteria Lab
NGSS Claim and Reasoning lab where students design and culture bacteria found on their phone. This is an open ended inquiry lab. Students are given a list of materials and asked to come up with their own procedures to support a claim.
This lab goes with a unit over Bacteria and Viruses. I use this lab as a replacement for the recipe lab of growing bacteria. Since students are designing a test, and using their own property, it makes the learning all that more relevant!
I use this lab i
Subjects:
Grades:
7th - 12th
Types:
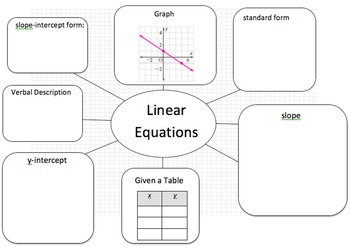
Linear Equation Web - Translate Between Linear Representations
This activity is an organized way to have students translate between various representations of a linear function (COMMON CORE F8.2; F8.3 and ALGEBRA 1 Standards). The idea plays on the outline web used to plan a five paragraph essay. I have used this as individual assignments, but the most effective strategy is to work in small groups or centers. The students have a great time helping each other if made into a game with prizes! I have included a blank web for you to be creative! Sometimes, I ha
Grades:
7th - 10th
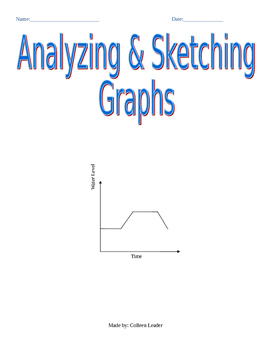
Analyzing & Sketching Graphs Lesson
This activity requires students to analyze qualitative graphs and explain what they represent. Some of the problems ask students to match scenarios to graphs, some require students to explain a graph in their own words, and finally the last problems ask students to construct a qualitative graph based on a description.

2-Variable Linear Inequalities BINGO game
This is a great way to review student understanding of the graphs of linear inequalities. There are 7 different BINGO cards with 24 pictures of graphs of 2-variable inequalities. The teacher reads the equation of a linear inequality and the stduents have to find the matching graph on their BINGO card. Students go for 5 in a row in any direction and I usually let them go for 5 in a row more than one time to keep the play going. The students absolutely LOVE this!
Subjects:
Grades:
8th - 11th
Types:
Showing 1-24 of 782 results


