1,248 results
8th grade graphing activity microsofts
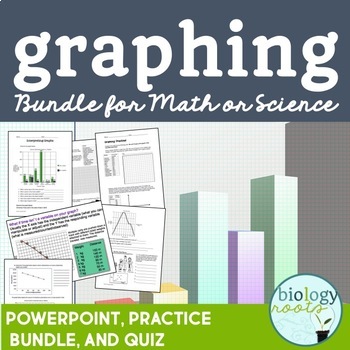
Graphing Bundle for Secondary
Complete and editable graphing bundle includes plenty of practice, editable PowerPoint notes to introduce or reinforce graphing concepts, as well as an assessment to finish it off! Suitable for grades 7 and up. Included in the package is:1. How to Interpret Graphs PowerPoint PresentationCovers line graphs, bar graphs, scatter plots and pie charts. Answers included on teacher version.Student notes included (PDF and PPT). 2. Interpreting Graphs- 3 pages of graph interpretation in which students an
Subjects:
Grades:
6th - 10th

Beaker Pong: Experimental Design and Graphing Lab, NGSS aligned
Great 1st week or 1st month STEM activity! All parts are EDITABLE and includes a graphing grid! This is a great way to introduce the "science process" (better phrase for scientific method) at the start of a semester or anytime you want fun to occur in your classroom.*****Focus on the NGSS PRACTICES Dimension*****The National Research Council's (NRC) Framework describes a vision of what it means to be proficient in science; it rests on a view of science as both a body of knowledge and an evidenc
Subjects:
Grades:
7th - 12th
Types:
Lucky Charms Cereal Data Analysis and Graphing Project St. Patrick's Day
Looking for a way to review data analysis and graphing skills without it being a bore? This Lucky Charms Cereal Data Analysis and Graphing Project is a fun activity to incorporate in March for St. Patrick's Day, but of course it works at any time of the year in a graphing unit or in a math-integrated unit. Your students will smile when you whip out the box of Lucky Charms and tell them that they are to pretend they are the Quality Control Department at the Cereal Company! This activity is fun an
Subjects:
Grades:
6th - 8th
Types:
NGSS:
MS-ETS1-4
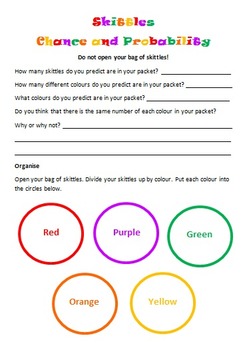
Skittles Chance and Probability (Editable)
Chance and Probability activity using yummy Skittles!!!
Students are to predict the colours and quantities before they open the skittles bag. Students are to complete a chance experiment where they use a tally to collect their data. Students then transfer their data in fractions, decimals and percentages. Students are to create a bar graph using their data as well as answer chance and probability questions about the data. I used this with my grade 5/6 students and they loved it!
Subjects:
Grades:
3rd - 10th
Types:
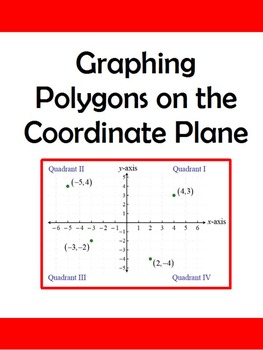
Graphing Polygons on the Coordinate Plane to Find Area/Perimeter
This activity asks the students to plot various ordered pairs on a coordinate plane and connect the points to make a polygon. Then they are expected to calculate the area and/or perimeter of each shape. The first worksheet has a square, two rectangles and a triangle. The triangle is starred to show higher level thinking. Each polygon is to be colored a different color. The second worksheet asks the students to plot the points of five polygons: a triangle, two rectangles and two composite f
Data Tables and Graphing Introduction and Practice
Students need practice creating data tables and graphs. Students also need to be able to interpret existing graphs. This lesson introduces students to data tables and graphs, teaches students how to create data tables from data, how to interpret tables and graphs, and offers hands-on opportunities to create data tables and graphs.
A 29-slide Power point presentation introduces data tables and graphing skills, offered in both 2003 and 2007 versions of Power point. Accompanying work pages in P
Subjects:
Grades:
5th - 8th
Blank Bar Graph/Double Bar Graph Template
This is a bar graph template that can be used by teachers to teach students how to understand bar graphs and create their own bar graphs. Teachers can use this template teach students about parts of a bar graph and how to interpret data in bar graphs.
Grades:
1st - 12th
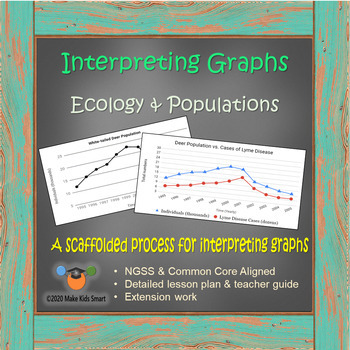
Interpreting Graphs - Ecology & Populations (17 slide Distance Learning Packet)
Teach students how to analyze and interpret line graphs, describe trends, and discuss data using a proven 5-step process. This is 2-3 periods of work suitable for distance learning and meant to move gradually from teacher led to independent work.All materials are found within this 17 page editable power point which is suitable for distance learning. Slides can be shared individually for student completion or shared as a full packet.Please check the preview to see exactly what you are downloading
Subjects:
Grades:
6th - 12th
NGSS:
HS-LS2-7
, MS-LS2-2
, MS-LS2-5
, HS-ESS3-2
, MS-LS2-4
...
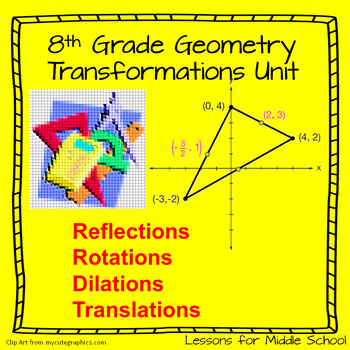
8 Grade Math - Reflections, Translations, and Rotations Geometry Unit
This is a COMPREHENSIVE unit for teaching students all of the 8th Grade Geometry COMMON CORE STATE STANDARDS associated with Dilations, Translations, Reflections, and Rotations. ABSOLUTELY NO PREP REQUIRED, just download and start teaching in minutes. This lesson is part of our Geometry Bundle for 8th grade that includes 9 weeks of lessons.LESSONS INCLUDED➯2 Lessons on Translations➯4 Lessons on Reflections➯6 Lessons on Rotations➯1 Review Lesson➯1 Dilations Project➯3 Formative Assessments*****
Subjects:
Grades:
7th - 9th
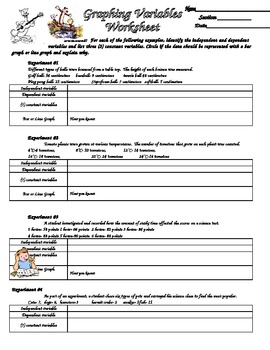
Scientific Method Variables and Graphing Practice
Students are given six different sets of experimental data and asked to identify the variables (independent, dependent etc.). They also reinforce graphing by identifying if the data should be represented with a bar or line graph. With this information, students the create data tables and graphs for the data.
Subjects:
Grades:
3rd - 12th
Types:
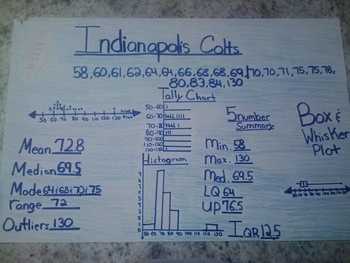
Favorite Sports Team: Data Displays and Measures of Central Tendency Project
Students will create a poster using sports statistics. Depending on the time of year, you may want to use football scores, basketball scores, data from the Olympics, etc. Students will use the internet (or you can print out statistics for them) to find sports data.
The students really buy into this project because it is about something they are interested in - their favorite sports team!
Students will display their knowledge of several data displays: line plot, tally chart, histogram and bo
Subjects:
Grades:
5th - 8th
Types:
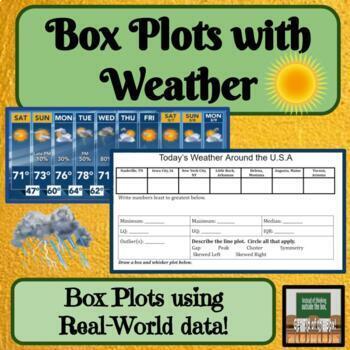
Box and Whisker Plots Real World Math Middle School Math
About this Resource:Students use current weather data from all over to create box plots using measures of variation. This is a create way to tie in some live science data! Topic Covered:*Measures of Variation/Variability*Describing Graphs*Box Plots / Box-and-Whisker Plots Ways to use this product in your classroom:-project-assessment-independent or partner work✓ Teacher Tested✓ Student Approved*This product has been used in my classroom and enjoyed by my students!Other products with similar con
Subjects:
Grades:
6th - 8th
Types:
Also included in: Box and Whisker Plots Line Plots Measures of Center Bundle Activities
Rotations - Transformation in 8th Grade Geometry
This is a collection of 6 Lessons with accompanying activities and practice worksheets to teach students the concepts of Rotations in the 8th Grade Common Core Math Standards with a focus on GeometryOnce you download this unit, you will not have to do anything except make copies for your students and guide them through the lessons, guided notes, practice problems, activities, and projects. The complete bundle for Transformations can be found here:8th Grade Geometry - Transformations Bundle*****
Subjects:
Grades:
6th - 9th
Also included in: 8th Grade Math Geometry Bundle 9+ weeks
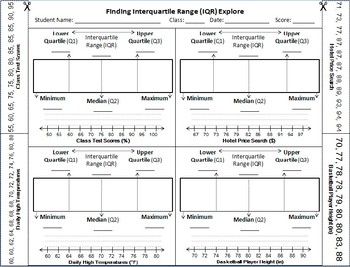
Finding and Comparing Interquartile Range (IQR)
This activity is designed for Texas TEKS listed below. Students use strips of data to fold into 'quartiles' and calculate the IQR.
represent numeric data graphically, including dot plots, stem-and-leaf plots, histograms, and box plots.[6.12A]
interpret numeric data summarized in dot plots, stem-and-leaf plots, histograms, and box plots.[6.13A]
compare two groups of numeric data using comparative dot plots or box plots by comparing their shapes, centers, and spreads.[7.12A]
Subjects:
Grades:
6th - 8th
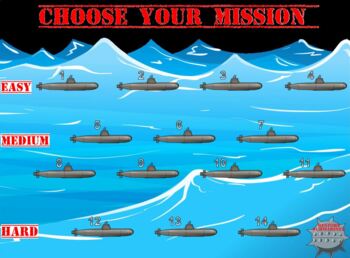
Coordinate Battleship for Graphing Ordered Pairs
UPDATES:Thank you for your feedback! Based on your suggestions, I've made the following changes for this version (version 2):1. You can now choose between EASY, MEDIUM, and HARD modes. For easy mode there are no gaps between hits. For medium mode there are gaps but the hits are evenly spaced. For hard mode, hits are randomly spaced.2. There's now a button that will reveal/hide submarines. You can use this as another tool for hints to students or you can reveal the submarine once students
Grades:
6th - 10th
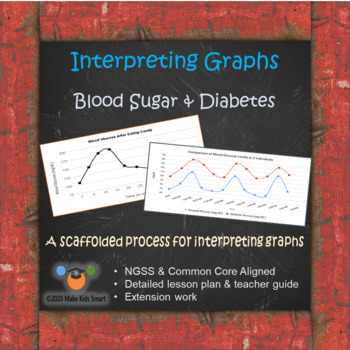
Interpreting Graphs - Blood Sugar & Diabetes (15 slide Distance Learning PPT)
Teach students how to analyze and interpret line graphs, describe trends, and discuss data using a proven 5-step process. This is 2-3 periods of work suitable for distance learning and meant to move gradually from teacher led to independent work. All materials are found within this 15 page editable power point which is suitable for distance learning. Slides can be shared individually for student completion or shared as a full packet.Please check the preview to see exactly what you are downloa
Grades:
6th - 12th
CCSS:
NGSS:
MS-LS1-2
, MS-LS1-3
, HS-LS1-2
, HS-LS1-3
Create Population Pyramids!
OverviewStudents will understand how to read a population pyramid by creating one! This activity includes two templates to help your students create their own population pyramids, as well as population data for four countries from the U.S. Census Bureau's International Database. The activity includes blank cards if you or your students would like to create additional or specific population pyramids. Instructions are included to help navigate the U.S. Census Bureau's website in order to obtain th
Grades:
6th - 12th
Types:
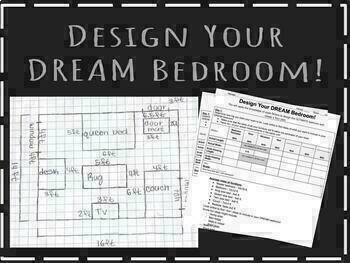
Fun Scale Drawing Project! (Minimal Prep)
Students will apply the knowledge of scale and scale factors to design their DREAM bedroom and create a floor plan! VERY MINIMAL PREP- all you have to do is print out the packets! Link for the project introduction Google slides included on the first page. Graph paper included on the third page.
Subjects:
Grades:
7th - 8th
Types:
CCSS:
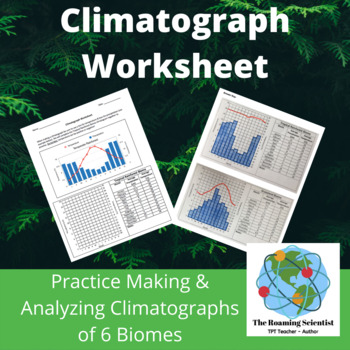
Printable Climatograph Worksheet
This comparative biome graphing worksheet asks students to create and analyze six climatographs for six of Earth’s major terrestrial biomes. Help your students develop graphing skills including drawing bar graphs, line graphs, dual y-axis graphs and interpreting data.This climatograph activity can be used as a lesson, homework assignment, it can be used in small groups or individually or as a revision activity. This is also an excellent substitute teacher lesson. This activity is easily modifiab
Subjects:
Grades:
6th - 12th
Types:
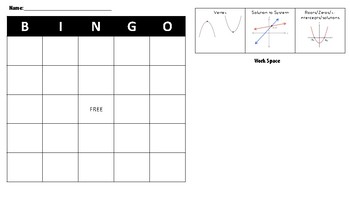
Algebra 1 EOC STAAR Review BINGO Game
Fun and interactive Bingo game is the perfect activity for the days leading up to the Algebra 1 EOC or as cumulative review throughout the year. This game is designed for scholars to solve questions by graphing on calculators as review before their EOC exam however answers can be found a variety of ways. The game includes the following topics:1. Finding Vertex of Quadratic Parabolas 2. Finding the Roots/Solutions of Quadratic Functions3. Finding the Solution to a System of Equations4. Finding t
Subjects:
Grades:
8th - 10th
Types:
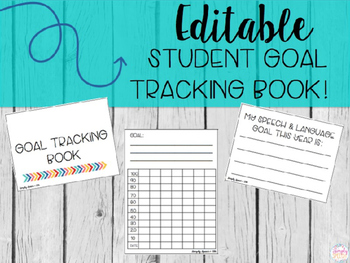
Editable Student Goal Tracking Book
These mini goal books are the perfect way to help your students keep track of their own goals. These books help increase student motivation and self awareness as they create their own personal goals and track their own progress.Here's what's included:Page 3: cover page options. This page is editable. Click on 'add text box' to add your students' names to their books.Page 4: Goal tracking sheets. Print as many of these pages as you need. This is also editable if you wish to type the goals in. Pag
Subjects:
Grades:
1st - 12th
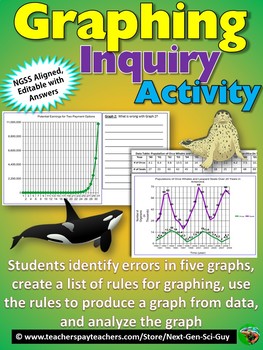
Graphing Inquiry Activity: NGSS Graphing and Data Analysis: Distance Learning
This activity proceeds as follows:1. Students are given a hypothetical scenario in which they are offered two different payment options for house-sitting a wealthy neighbor's house, and have to fill in a data table by calculating the earnings for each option 2. Students then evaluate five different graphs, each of which incorrectly represents the data in some way. They must find the mistakes.3. Students then generate a list of rules for proper graphing4. Students use their rules, and data on or
Grades:
7th - 12th
Types:
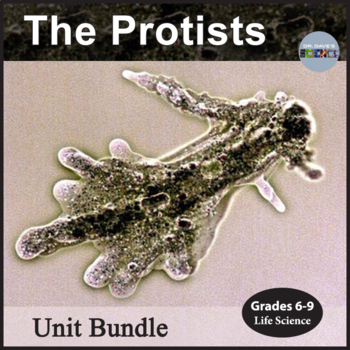
Protists Unit Bundle Protista Kingdom
This unit bundle contains both a 75-slide Protist PowerPoint as well as 19-page activity packet for the Protists. You receive a 20% discount on both resources when you purchase this bundle. Please click on the individual resources for more information. Terms of UseCopyright © Dr. Dave's Science. All rights reserved by author. This product is strictly for individual use and may not be copied or given to other teachers. Copying any part of this product and placing it on the Internet in any form (
Grades:
6th - 9th
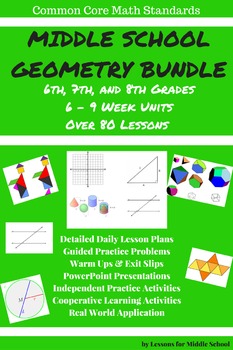
Geometry - Middle School Bundle: Grades 6-8 Geometry Standards - 27+ Weeks
This is a comprehensive and complete unit for teaching all the Common Core Geometry Standards. It can also be used for remediation, review and enhancement for a grade level above or below. Once you download this unit, you will not have to do anything except make copies for your students and guide them through the lessons, guided notes, practice problems, activities, and projects. Middle School - Grades 6-8 Geometry Standards BundleAll grade level units include the following materials and resou
Subjects:
Grades:
6th - 8th
Showing 1-24 of 1,248 results


