40 results
8th grade graphing activities for Microsoft Excel
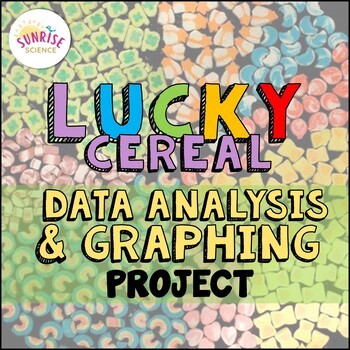
Lucky Charms Cereal Data Analysis and Graphing Project St. Patrick's Day
Looking for a way to review data analysis and graphing skills without it being a bore? This Lucky Charms Cereal Data Analysis and Graphing Project is a fun activity to incorporate in March for St. Patrick's Day, but of course it works at any time of the year in a graphing unit or in a math-integrated unit. Your students will smile when you whip out the box of Lucky Charms and tell them that they are to pretend they are the Quality Control Department at the Cereal Company! This activity is fun an
Subjects:
Grades:
6th - 8th
Types:
NGSS:
MS-ETS1-4
Excel Lessons - Creating Charts
No Prep! These lessons are great as a first Excel Chart lesson or for students already a little familiar with creating charts. Students love the data for these charts because the data is centered around things they love – their cell phones! In Lesson 1, students will create 5 different charts from step-by-step directions which include Chart Titles, Chart Styles, Axis Titles, Data Labels, and Moving Chart to its own Sheet.In Lesson 2, students will create 5 charts from provided data as well as ch
Grades:
5th - 12th
Types:

Excel Spreadsheets Million Dollars Activity
This resource allows students to understand the following: How graphs change when spreadsheet data is alteredUse of SUM() functionsHow graphs are madeComponents of a graphAdvantages of spreadsheets over pen and paper methodsStudents use this resource to understand how altering data in spreadsheets allow graphs to change. They understand such concepts by trying to spend a Million Dollars in a minute. Students are then expected to complete the associated worksheet which accompanies the spreadsheet
Grades:
5th - 12th, Adult Education
Types:
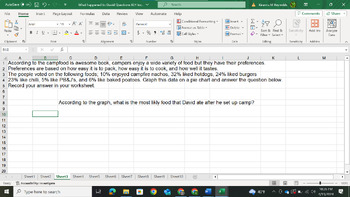
What Happened to David Graphing Exercise
This is a graphing exercise where students have to work through a series of graphing challenges to find out what happened to David. I would suggest that the first one be done as a class and that the What Happened to David Handout is also purchased to go along with this exercise (found on my page). Sheets 1-5 are student pages and sheets 6-10 are the answer key.
Grades:
8th - 10th
Types:
Also included in: What Happened to David Bundle
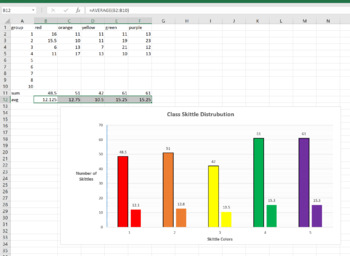
Skittle Statistics MS Excel Mini-Lab
This is a 1 class MS Excel lab for a computer or math class. You can have the students explore the distribution of different color Skittles in class. This is a great mini-lab or half-day activity when you school ends up with a weird schedule day. Tell them they can't eat till the Skittles till the end of class, or they will distort their numbers. Also make sure they don't throw them or shove them up their nose (Yes, stuck Skittles are hard to extract, ask me how I know..)The goal of this lab is
Grades:
6th - 12th, Higher Education, Adult Education
Types:
NGSS:
MS-ETS1-2
, HS-ETS1-2
, HS-ETS1-3
, MS-ETS1-4
, MS-ETS1-1
...
Also included in: Hands-on Science Semester Labs Bundle
Manage Sports Statistics in Google Drive / Google Sheets - Activity
Use Google Sheets to analyze sports data
This activity lets students practice several fundamental spreadsheet skills, including:
-renaming documents
-adding formulas
-inserting / formatting charts
Screenshots demonstrate how to do all of the above in Google Sheets, the spreadsheet application in the Google Drive suite. You can add additional statistics to customize the assignment for your students and adjust the level of difficulty.
Aligned to the following Massachusetts Technology Literacy
Grades:
5th - 8th
Types:
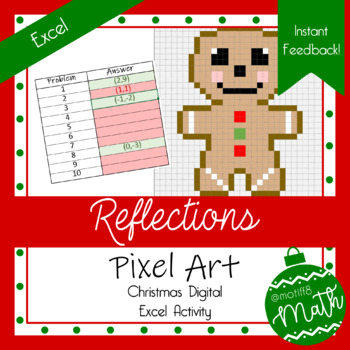
Christmas Pixel Art | Reflections | Digital Geometry | Instant Feeeback
Product Description: This Christmas themed, pixel art activity covers reflections! Students are given three points on a graph and asked to reflect one of the points. There are 10 problems. Students will reflect over the y-axis twice, the x-axis twice, the line y=x twice, a horizontal line twice, a vertical line once, and the y=-x line once.Objective: Students will be able to reflect points over various lines of reflection.Excel Student Instructions: Students will work all ten problems on the pro
Subjects:
Grades:
7th - 11th
Types:
Also included in: Christmas Transformation Bundle
Rational Numbers - Super Sleuths - Culminating Activity (Mathematics)
You've finished your unit on Rational Numbers and now you're looking for a culminating activity that's different, fun and challenging at the same time! "Super Sleuths" is just what you're looking for!!Students will use what they've learned about Rational Numbers to track down the evil Dr. Irrational! He's escaped from prison and through a series of challenges, your students will be able to track him down and send him back to prison.Activities include graphing, drawing images in the coordinate
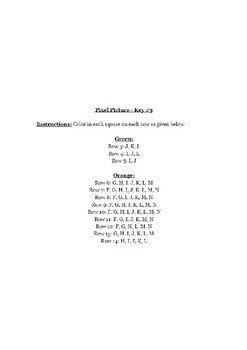
Halloween Pixel Art Excel/Google Sheets
Microsoft Excel activity to use upper elementary or middle school students? This great lesson incorporates art as students learn the basics of Microsoft Excel.These are also fun lessons to use if you just need something for a one day lesson.
This download includes:
1. Teacher & Student Resources
2. Excel Template for Pixel Art
3. Legends and Sample Pictures for 3 Halloween Pictures
When completed let students make their own pictures, they will love it!
I've used this with 6th and 7th gra
Subjects:
Grades:
5th - 9th
Types:
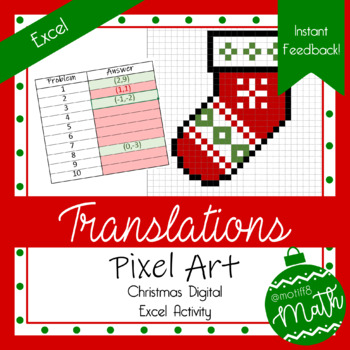
Christmas Pixel Art | Translations | Digital Geometry | Instant Feedback
Product Description: This Christmas themed, pixel art activity covers translations! Students are given three points on a graph and asked to translate one of the points according to the given translation rule.Objective: Students will be able to translate a point on a graph.Excel Student Instructions: Students will work all ten problems on the problems tab and then input their answers on the image tab. When entering their answers, students must use parentheses, a comma, and NO spaces. As students
Subjects:
Grades:
7th - 11th
Types:
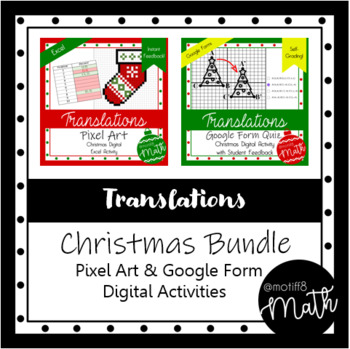
Translations Christmas Bundle | Excel Pixel Art & Google Forms | Feedback
This Christmas bundle includes a 10 question Pixel Art Activity and a 10 question Google Form covering translations. The Pixel Art activity is more of an introduction to translations and the Google Form consisted of more advanced questions! This bundle would also be a great way to differentiate within your classroom or have options for a choice board! Please review each product individually for more details!Christmas Translations Pixel Art ActivityChristmas Translations Google Form
Subjects:
Grades:
8th - 11th
Types:
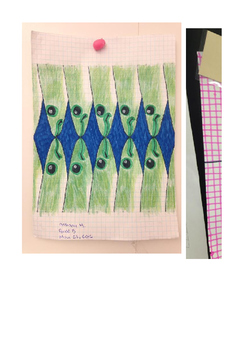
Parabola Art
this is a great activity to do after teaching the vertex form of the quadratic equation. Also very good for understanding 'domain.' Kids construct 10 parabolas based on specific domain. This is especially fun for kids that are artistic.
Subjects:
Grades:
8th - 10th
Types:
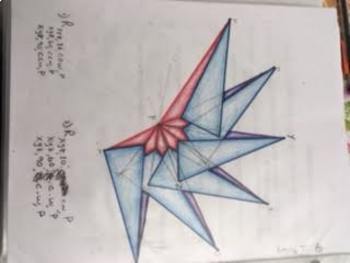
Rotations- Art in Motion
This is a great activity for practicing Rotations of any degree around any point. Students will need a protractor and a ruler and the provided template.
Could be used for a test review or an assignment after topic is taught. Students interested in art love this one.
Subjects:
Grades:
8th - 10th
Types:
Spreadsheet Interactive Lesson {6.SP.4}
Looking for step by step instructions for interactive note booking using spreadsheets? This file is exactly what you need! There are complete instructions for notebook organization and how students use a self assessment stop light graphic organizer to communicate their comprehension of the lesson. This lesson includes complete instructions and student black line masters. There are also pictures of sample pages. My student's favorite part of this lesson is entering the data on computers and creat
Subjects:
Grades:
4th - 8th
Types:
CCSS:
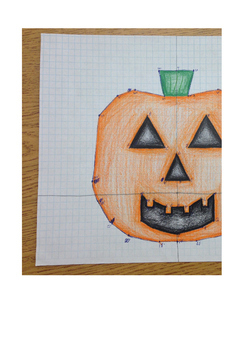
Pumpkin Transformations
This is a fun, artistic activity involving graphing on the coordinate plane, translations, and reflections. It is a great activity after translations and reflections have been taught, and best for doing in the
fall as the outcome is a pumpkin.
It could also be used as an assessment.
Materials needed: pencil, graph paper, crayons/markers/colored pencils.
Grades:
7th - 9th
Types:
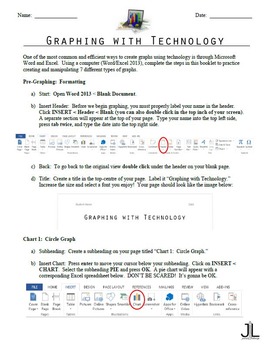
Graphing with Technology (Microsoft Word/Excel 2013)
Help students learn to create graphs using technology! This graphing with technology booklet acts as a compressed guide and practice sheet for Microsoft Word/Excel 2013.
Each graph contains step-by-step directions and screen-capture images so that students will never get lost. In addition, the data used in this assignment is both relatable and engaging for teenage target groups.
By completing this task, students will be able to create 7 different types of graphs using technology:
- pie gra
Subjects:
Grades:
8th - 12th, Higher Education, Adult Education
Types:
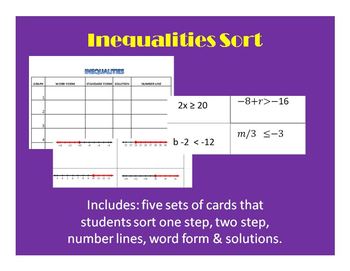
Inequalities Sort
Students use the inequalities recording sheet (chart) to show matched card sets.
The activity includes five sets of cards that students sort: one step inequalities, two step inequalities, number line graphs of inequalities, inequalities written in word form & solutions to inequalities.
I recommend printing the five types of cards on different colors of paper and having students match them one color at a time. This could be done in groups, alone or in pairs. This could also be used as a st
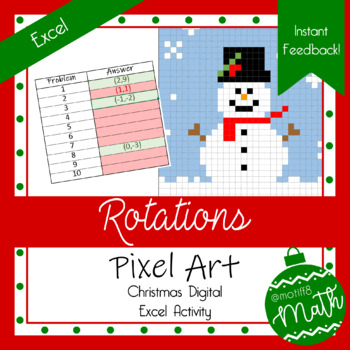
Christmas Pixel Art | Rotations | Digital Geometry | Instant Feedback
Product Description: This Christmas themed, pixel art activity covers rotations! Students are given three points on a graph and asked to rotate one of the points by 90°, 180°, or 270° either clockwise or counter clockwise on 9 of the problems. The last problem is a bit tougher because the students will need to know that rotating 90° three times is the same as a 270° rotation in the same direction.Objective: Students will be able to rotate points on a graph.Excel Student Instructions: Students wi
Subjects:
Grades:
7th - 11th
Types:
Also included in: Christmas Transformation Bundle
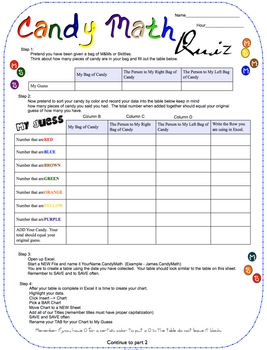
Candy Math Quiz for Grades 3-8
This quiz is a fun way to assess your students in their chart making skills in Excel along with their problem solving skills.
Part 1 of the quiz students are to pretend they have been given a bag of candy. They are to create a table then a chart with their data.
Part 2 of the quiz you give your students candy and this time they have to record the actual amount and make a table and a chart.
Part 3 of the quiz test basic formula writing.
Common Core - 3.MD.3. Draw a scaled picture graph and
Subjects:
Grades:
3rd - 9th
Types:
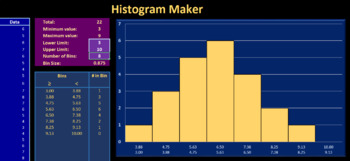
Histogram Maker - Excel
This Excel spreadsheet produces a nicely formatted histogram that updates in real time with your data and parameters. All you have to do is enter your data, choose your upper and lower limits, and specify the number of bins.This spreadsheet is locked to avoid user error, but can easily be unlocked to allow for the editing of formulas and formatting.Note: This spreadsheet does not utilize Excel's histogram function, making it more accessible for those who do not have the Data Analysis Toolpack ad
Subjects:
Grades:
6th - 12th
Types:
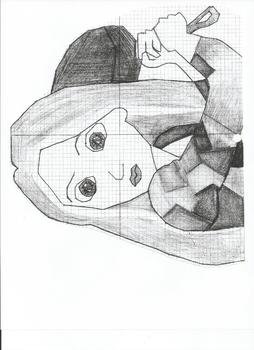
Rapunzel Coordinate Plane Picture
Students will graph the ordered pairs and connect them to create a Rapunzel picture. Uses all 4 quadrants on the coordinate plane. Can be used as an extra credit project or a way to practice graphing ordered pairs.
Subjects:
Grades:
6th - 8th
Types:
CCSS:
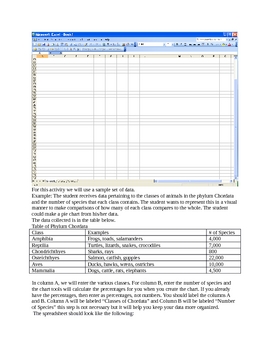
Creating Pie Charts with a Spreadsheet Program
This is a lesson/tutorial on how to create great looking pie charts using spreadsheet tools like MS Excel or Google Docs. Included is an independent practice section for students to complete and many visuals.
Grades:
7th - 12th
Types:
Who's Taking Out the Trash? An Experimental Probability Activity
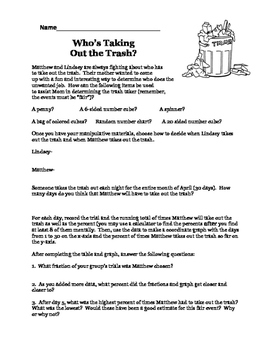
When deciding the probability of an event through experimentation, how many trials are enough? 10? 1,000? 1,000,000??? This activity is a cooperative grouping activity that focuses on just that. The pre-lesson set up reels the students in. The activity engages them. The manipulative materials involve them. An Excel extension is also available to combine the results of multiple groups. Through this activity, students really see how more trials leads to a better understanding of the true pr
Subjects:
Grades:
6th - 8th
Types:
CCSS:
Automatic Bar Graph Maker
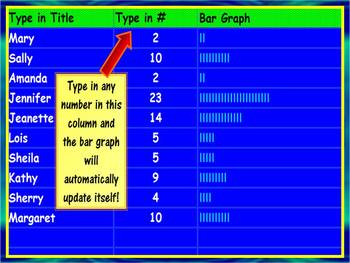
This activity can be used to teach students of all ages about bar graphs. This spreadsheet can be used to introduce the concept of bar graphs to elementary students as well as implemeted by mid-level & high school students in lab reports and/or presentations. It is extremely quick and easy to use! Just type in a set of numbers and it automatically creates a simple bar graph. And check out my other graph templates for line and bar graphs! They are definately worth your time!
Grades:
K - 12th
Types:
Showing 1-24 of 40 results


