Introduction to Parent Functions: Lesson, Posters, Flash Cards
Janet Knox Secondary Math
594 Followers
Grade Levels
9th - 11th, Higher Education, Homeschool
Subjects
Resource Type
Standards
CCSSHSF-IF.A.1
CCSSHSF-IF.A.2
CCSSHSF-IF.B.4
Formats Included
- PDF
Pages
40 pages
Janet Knox Secondary Math
594 Followers
Description
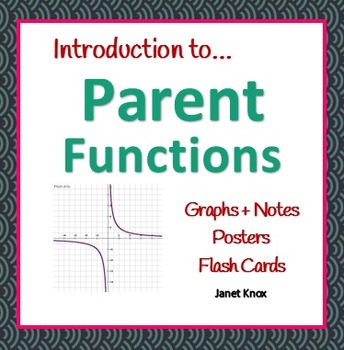
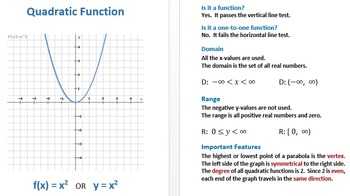
Features large graphs, notes, bulletin-board posters, flash cards, and a study sheet for a linear, quadratic, absolute-value, cubic, rational, and square root parent function.
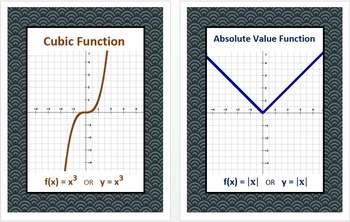
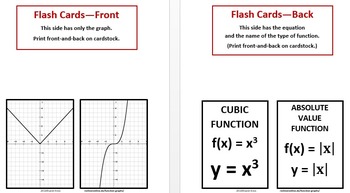
Posters have thick, bold graphs with a decorative border. Notes address domain, range, end behavior, vertex, inflection point, and asymptotes. Flash cards have graphs on front, equations on the back.
**Click the preview to see a sample.**
Related products…
Activity Bundle: Parent Functions and Transformations, 50% Savings
Parent Functions and Transformations, Personality Match-Up Bundle
Two-for-One Deal: Graphing Reflections and Shifts
Graphing Reflections and Shifts of Parent Functions: Parts 1 and 2
Quadratic Functions, Personality Match-Up
Quadratic Equations Algebra Activity: Personality Match-Up, Two Levels
Linear Functions, Personality Match-Up
Valentine's Day Algebra Activity: Linear Equations Personality Match-Up
Total Pages
40 pages
Answer Key
N/A
Teaching Duration
45 minutes
Report this resource to TPT
Reported resources will be reviewed by our team. Report this resource to let us know if this resource violates TPT’s content guidelines.
Standards
to see state-specific standards (only available in the US).
CCSSHSF-IF.A.1
Understand that a function from one set (called the domain) to another set (called the range) assigns to each element of the domain exactly one element of the range. If 𝘧 is a function and 𝘹 is an element of its domain, then 𝘧(𝘹) denotes the output of 𝘧 corresponding to the input 𝘹. The graph of 𝘧 is the graph of the equation 𝘺 = 𝘧(𝘹).
CCSSHSF-IF.A.2
Use function notation, evaluate functions for inputs in their domains, and interpret statements that use function notation in terms of a context.
CCSSHSF-IF.B.4
For a function that models a relationship between two quantities, interpret key features of graphs and tables in terms of the quantities, and sketch graphs showing key features given a verbal description of the relationship.


