50 results
6th grade statistics outlines for GATE
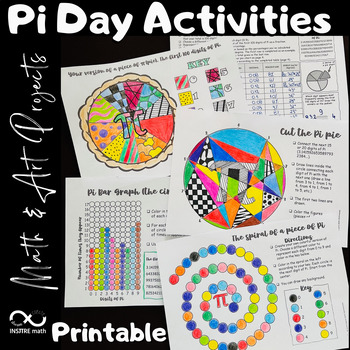
4 Pi Day Math Activities | Math & Art Projects | Coloring Circles | Pie Chart
4 Math & Art Projects to celebrate Pi Day that include circles and Pi exploration! Your students will love these Pi Day activities! Let your students express themselves using these hands-on Math & Art resources during the exploration of Pi.Content:- Your version of a piece of π (pie). The first 100 digits of Pi. Frequency Pie Chart.- Pi Bar Graph - the circular version.- The spiral of a piece of Pi.- Cut the Pi pie.This resource includes:- The editable PowerPoint™ version.- The printable
Subjects:
Grades:
4th - 8th
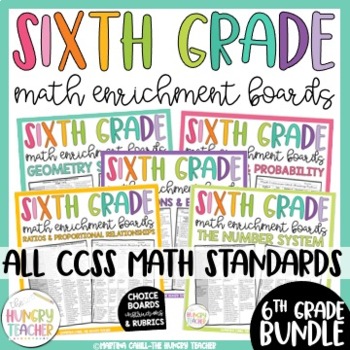
Math Enrichment Choice Board Sixth Grade for Ratios Statistics Number System
This resource includes math enrichment choice boards, rubrics, and instructions for every single 6th grade math Common Core State Standard for ratios, proportional relationships, expressions and equations, statistics and probability, geometry, and the number system. These are great for early finishers and students who need enrichment in math. Included in this pack are the math enrichment boards I use for my sixth grade learners who have mastered any of our math concepts and are now ready for a c
12 Days of Christmas: A Computer Spreadsheet Activity
This great holiday activity shows students how to use a computer spreadsheet to calculate the cost of their true love's gifts in today's dollars.The simple step-by-step procedure will allow both beginning and computer-savvy students to experience success as they learn how to use spreadsheet software. Students will enjoy the engaging and entertaining activity. No computer? No problem! Use the activity master so students can calculate the costs themselves.
Grades:
5th - 9th
Types:
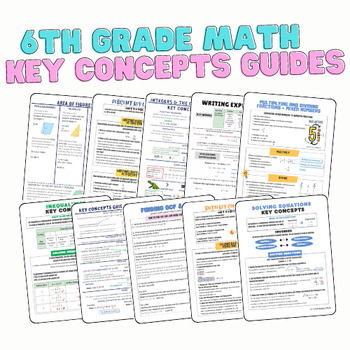
6th Grade Math: Key Concepts Guides/Anchor Charts BUNDLE
Give your students the KEY to success by purchasing this key concepts guides/anchor charts bundle. This bundle is a MUST HAVE resource for 6th grade classrooms and would also be a great one for 7th grade classrooms to have the important foundations to grow their knowledge! This bundle includes guides for ALMOST ALL 6th grade common core standards with just a few that are not addressed such as multiplying and dividing decimals using standard algorithm.Purchasing as a bundle saves you $7.50!The to

Statistics Survey Project - Project Based Learning (PBL) with Math
Watch your students dive into the world of math as they create, execute, and analyze their own survey! Students will demonstrate mastery of data gathering, survey sampling, developing appropriate survey questions, data tables, Direct Variation, discrete graphs, dot plots, box and whisker graphs, and calculating the inter-quartile range.The Unique Survey Project is highly engaging, capitalizing on the innate curiosity of the adolescent mind. You will love the low-prep instructional guide. Your st
Subjects:
Grades:
6th - 10th
Types:
Also included in: Fun with Ratios Activities Bundle - 7th Grade PBL with Math
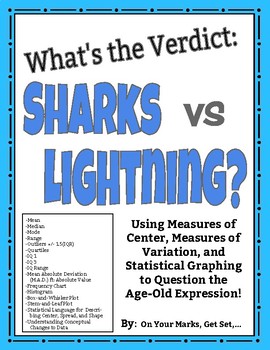
What's the Verdict: Sharks vs. Lightning? Modes of Center, Spread, and More!
Put it to the test! Use the age-old expression: "You are more likely to get struck by lightning than to be bitten by a shark!" to learn and practice Measures of Center, Measures of Spread, Measures of Shape, and Statistical Graphing including:MEANMEDIANMODERANGEOUTLIERS [Using IQR +/- 1.5(IQR)]QUARTILES [lower quartile (IQ-1) and upper quartile (IQ-3)]INTERQUARTILE RANGE (IQR)MEAN ABSOLUTE DEVIATION/ M.A.D. ft. ABSOLUTE VALUESYMMETRY/ASYMMETRY OF DISTRIBUTIONCLUSTERS AND GAPSBELL SHAPED CURVE AN
Subjects:
Grades:
5th - 12th, Higher Education, Adult Education
Types:
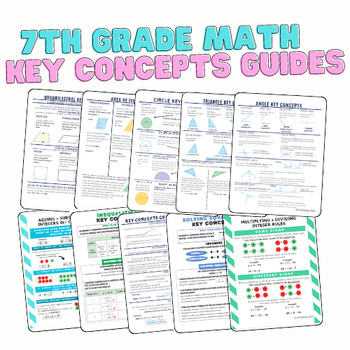
7th Grade Key Concepts Guides/Anchor Charts: BUNDLE
Give your students the KEY to success by purchasing this key concepts guides/anchor charts bundle. This bundle is a MUST HAVE resource for 7th grade classrooms and would also be a great one for 8th grade classrooms to have the important foundations to grow their knowledge!Purchasing as a bundle saves you $7.00!The topics included in this bundle are:1. Adding and Subtracting Integers2. Multiplying and Dividing Integers3. Solving and Writing Equations4. Solving and Graphing Inequalities5. Circles:
Subjects:
Grades:
6th - 8th
Types:
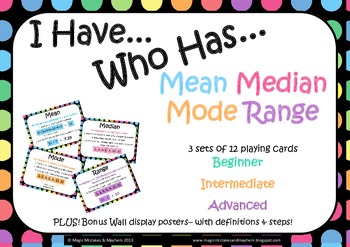
Mean, Median, Mode, Range "I Have Who Has" Game
A GREAT, FUN WAY FOR KIDS TO PRACTICE AND REINFORCE THEIR SKILLS IN THIS TRICKY TO REMEMBER AREA!3 DIFFERENT LEVELS! This pack includes 36 cards for the game "I Have Who Has" with a focus on Mean, Median, Mode and Range. The cards are split into three levels to be played in small groupsBeginner (green cards)Intermediate (orange cards)Advanced (purple cards)The aim of the game is to quickly work out the problem on your card so that when some one asks "who has...." if it is you then you can answe
Subjects:
Grades:
4th - 7th
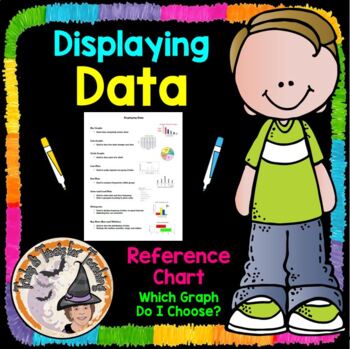
Displaying Data Reference Chart Notes Which Graph Do I Choose?
Math Teachers ~ You'll LOVE this Displaying-Data, Which-Graph-Do-I-Choose? Data-Display Reference-Chart will be SUPER helpful to your students in helping them determine which graph to choose, and provides a quick visual picture to remind them what that particular graph looks like. I printed one of these for each of my students to put inside their Math Toolkit Notebook, to use as a Reference for Data Displays Charts and Graphs. You'll enjoy using this year after year!Be sure to L@@K at my other 1
Subjects:
Grades:
5th - 8th
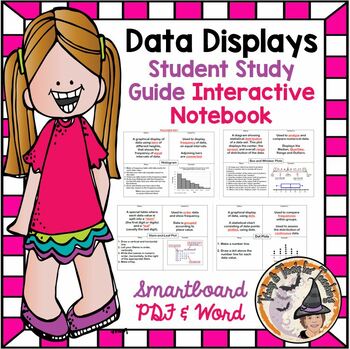
Data Displays Interactive Notes Stem Leaf Box Whiskers Histogram Dot Plots
Teachers ~ You'll LOVE these Interactive Notes that covers the following 4 data displays; Stem and Leaf Plot, Box and Whisker Plot, Histogram, and Dot Plot. The zipfile contains the Teacher's KEY version along with the Student's Fill in the Blank outline for Note Taking. You get BOTH the Students' Notes and the Teacher's KEY in both Word and Pdf formats for easy printing, along with Smartboard slides of everything as well. You'll LOVE using this year after year! Be sure to L@@K at my other 1,285
Subjects:
Grades:
5th - 7th, Staff
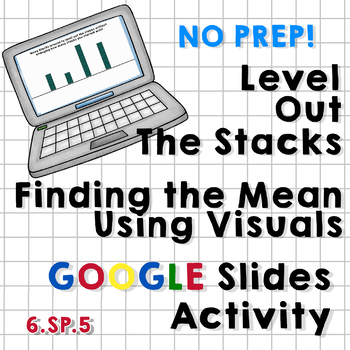
Level Out the Stacks - Finding Mean Using Visuals - Google Slides Activity
This Google Slides Activity includes 25 unique slides that help students to find the mean of a set of data using visuals first (stacks of blocks of varying heights), then eventually proving their answer by performing the actual calculations.
The slides become moderately more difficult as students progress through the activity, ending with several decimal problems where the cubes they're working with are split into fourths and the calculated mean is a decimal.
The slides are easy to duplicate
Subjects:
Grades:
5th - 7th
Types:
CCSS:
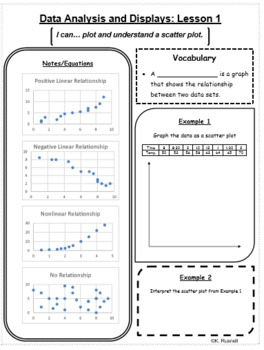
Data Analysis and Displays Notes
These guided notes are created to help differentiate and guide instruction for the math curriculum. This set of notes has been written based off of 8th grade standards and follows the Big Ideas Curriculum, but can be used for similar grades. Each page of notes includes an "I can" statement, vocabulary, student notes, step-by-step guides, examples, and story problems. Each notes is reduced to one page for quick reference. The vocabulary cards that go along with the vocabulary within the notes can
Subjects:
Grades:
6th - 10th
Types:
7th Grade Common Core Probability and Statistics Unit
Probability and Statistics Unit for 7th Grade Math Common Core
Lessons include:
Mean, Median, Mode, and Range
When to Use Each Measure
Mean Absolute Deviation - How to Calculate
Mean Absolute Deviation - Analysis
Sampling and Biased Surveys
Making Predictions from Survey Results
Simple Probability (Single Event)
Compound Probability - Independent Events
Compound Probability - Dependent Events
Subjects:
Grades:
6th - 8th
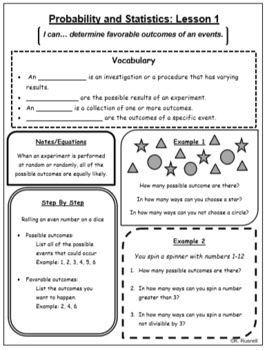
Probability and Statistics
These guided notes are created to help differentiate and guide instruction for the math curriculum. This set of notes has been written based off of 7th grade standards and follow the Big Ideas Curriculum, but can be used for similar grades. Each page of notes includes an "I can" statement, vocabulary, student notes, step-by-step guides, examples, and story problems. Each notes is reduced to one page for quick reference. The vocabulary cards that go along with the vocabulary within the notes can
Subjects:
Grades:
6th - 8th
Types:
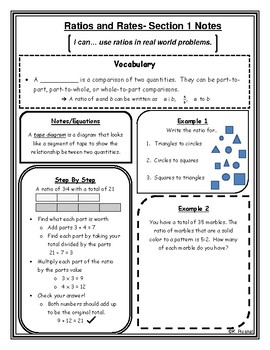
Ratios and Rates Notes
These guided notes are created to help differentiate and guide instruction for the math curriculum. This set of notes has been written based off of 6th grade standards, but can be used for similar grades. Each page of notes includes an "I can" statement, vocabulary, student notes, step-by-step guides, examples, and story problems. Each notes is reduced to one page for quick reference. The vocabulary cards that go along with the vocabulary within the notes can be found on my page as, "Math Vocabu
Subjects:
Grades:
5th - 8th
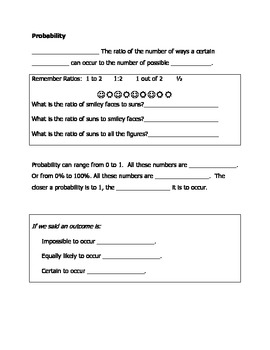
Interactive Notebook Probability Guided Notes: Theoretical vs Experimental
Guided notes discussing the concepts of Probability as a ratio, fraction, and percent. Further discussion compares Theoretical and Experimental Proability, the definitions, and forumulas to calculate. For 5th - 8th grade general education or special education classrooms. Great for your interactive notebooks.
Subjects:
Grades:
4th - 9th
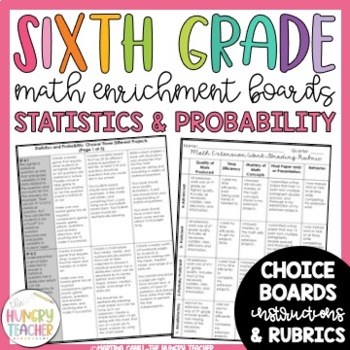
Math Enrichment Board for Statistics and Probability Sixth Grade | Choice Board
Included in this pack is the sixth grade math enrichment boards I use for my sixth grade learners who have mastered any of our statistics and probability math concepts and are now ready for a challenge. These choice boards give students choice, ownership, and a challenge through focused standard based projects. Included in this pack are the math enrichment boards I use for my sixth grade learners who have mastered Statistics and Probability concepts and are now ready for a challenge. There are t
Subjects:
Grades:
6th
Types:
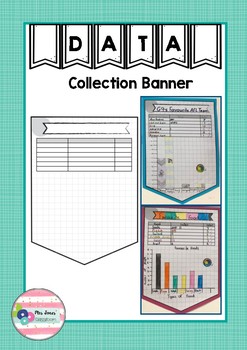
Data Collection Banner
Are your students collecting their own data and representing it using a graph this term? Then why not get them presented on this banner pendant and display them in your room.
Subjects:
Grades:
1st - 10th
Types:
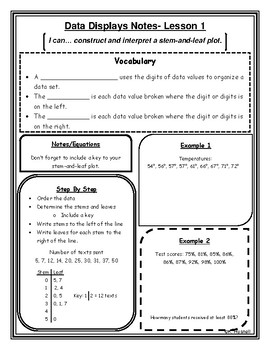
Data Displays Notes
These guided notes are created to help differentiate and guide instruction for the math curriculum. This set of notes has been written based off of 6th grade standards, but can be used for similar grades. Each page of notes includes an "I can" statement, vocabulary, student notes, step-by-step guides, examples, and story problems. Each notes is reduced to one page for quick reference. The vocabulary cards that go along with the vocabulary within the notes can be found on my page as, "Math Vocabu
Subjects:
Grades:
5th - 8th
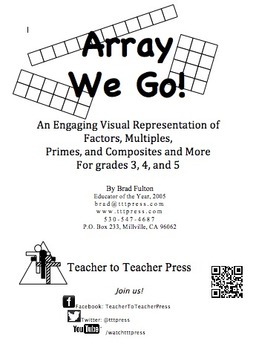
Array We Go! Introducing Multiplication, Factors, Primes, & Composites
This is an engaging and visual way to introduce multiplication and the concepts of factors, multiples, primes, composites and MORE! Students build arrays for the numbers 1–25 and look for patterns and characteristics that help them learn to recognize multiples. Directed questions also help them to learn to identify primes and composites. Square numbers, factor rich numbers, and perfect numbers are included for more advanced students.
Extensions allow you to take the lesson to a multi-day in dept
Subjects:
Grades:
3rd - 6th
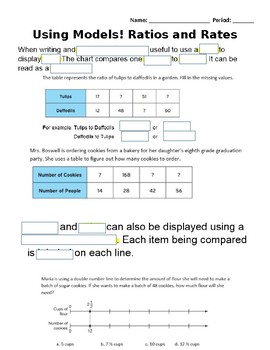
Using Models to Represent Ratios, Rates and Unit Rates Scaffold Notes
Students will use these fill in the blank notes to guide them through the Smartboard lesson on Models for ratios, rates and unit rates (located in store). Each page of the lesson is a screen shot with missing words. Students will fill in the blank and answer practice problems on handout. There is a lot an answer doc with the missing words filled in for any students with accommodations.
Subjects:
Grades:
5th - 7th
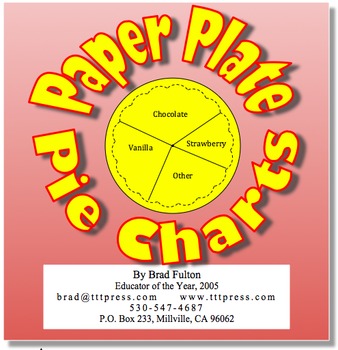
Paper Plates Pie Charts: It's As Easy as Pie!
This activity allows students to analyze data and draw conclusions about data without spending inordinate amounts of time creating the graphs. Students will be able to quickly create accurate pie charts that can be used for critical thinking activities. Two versions are explained, one which will work for any sample size, and a second simpler method that does not require rigorous calculations to determine the degree measures. Four copy masters are included so you don't even have to buy paper pla
Subjects:
Grades:
4th - 7th
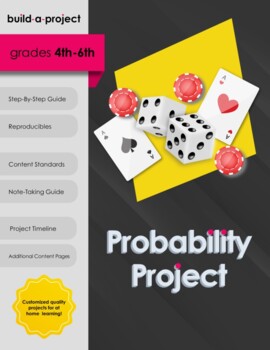
Probability Math Project
The Probability Project is great for students 4th-6th grades. Students survey friends and family to gather data and use it to practice and learn probability. Students will learn how to calculate mean, median, mode, and draw charts. Packet includes helpful information sheets and flashcards for students to use and learn. This is an engaging and comprehensive project your student will love!Subjects: Math, Writing, and ArtGrades: 4th-6thAges: 8-12 years oldDuration of Project: 2 weeksPages: 21Please
Subjects:
Grades:
4th - 6th
Types:
Also included in: 2nd-6th Grade Bundle
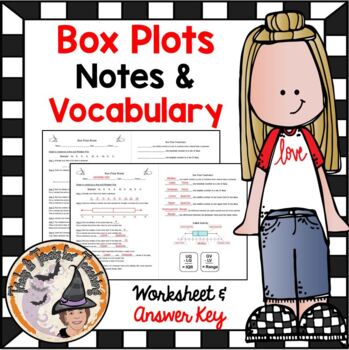
Box and Whisker Plots Notes and Practice Worksheet with Answer Key
Math Teachers ~ You'll love this AMAZING Box-and-Whisker-Plots-Notes-and-Practice, 2 page pdf where students take notes and practice creating and labeling a Box-Plot. The Zipfile contains the 2 page pdf printable worksheet and the 2 page Answer KEY. You'll LOVE using this year after year to introduce and practice Box Plots. This can be used as a Guided Practice, Math Station, Homework, or Independent Work. Answer KEY included. Learn to love teaching this skill with this terrific resource that st
Subjects:
Grades:
6th - 7th
Also included in: Box & Whisker Plots Smartboard Slides Notes Worksheet BUNDLE
Showing 1-24 of 50 results


