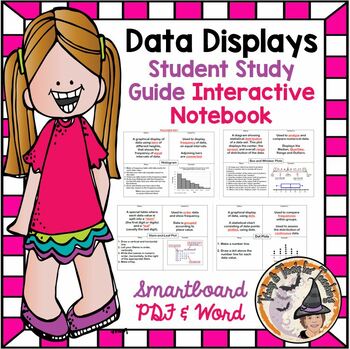
Data Displays Interactive Notes Stem Leaf Box Whiskers Histogram Dot Plots
Tricks and Treats for Teaching
733 Followers
Grade Levels
5th - 7th, Homeschool, Staff
Subjects
Resource Type
Standards
CCSS6.SP.A.2
CCSS6.SP.A.3
CCSS6.SP.B.4
CCSS6.SP.B.5
CCSS6.SP.B.5a
Formats Included
- Zip
Pages
5 pages
Tricks and Treats for Teaching
733 Followers
Description
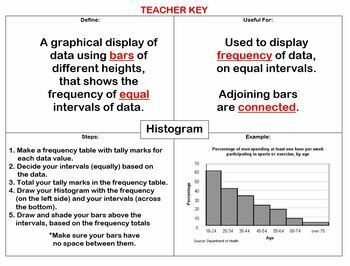
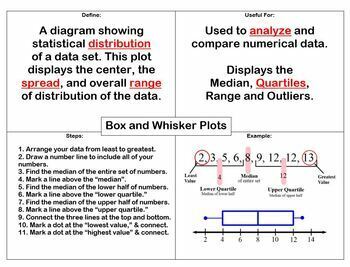
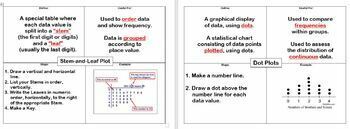
Teachers ~ You'll LOVE these Interactive Notes that covers the following 4 data displays; Stem and Leaf Plot, Box and Whisker Plot, Histogram, and Dot Plot. The zipfile contains the Teacher's KEY version along with the Student's Fill in the Blank outline for Note Taking. You get BOTH the Students' Notes and the Teacher's KEY in both Word and Pdf formats for easy printing, along with Smartboard slides of everything as well. You'll LOVE using this year after year!
Be sure to L@@K at my other 1,285+ TERRIFIC teaching resources!
~ ~ THANK YOU KINDLY ~ ~
Total Pages
5 pages
Answer Key
Included
Teaching Duration
N/A
Report this resource to TPT
Reported resources will be reviewed by our team. Report this resource to let us know if this resource violates TPT’s content guidelines.
Standards
to see state-specific standards (only available in the US).
CCSS6.SP.A.2
Understand that a set of data collected to answer a statistical question has a distribution which can be described by its center, spread, and overall shape.
CCSS6.SP.A.3
Recognize that a measure of center for a numerical data set summarizes all of its values with a single number, while a measure of variation describes how its values vary with a single number.
CCSS6.SP.B.4
Display numerical data in plots on a number line, including dot plots, histograms, and box plots.
CCSS6.SP.B.5
Summarize numerical data sets in relation to their context, such as by:
CCSS6.SP.B.5a
Reporting the number of observations.


