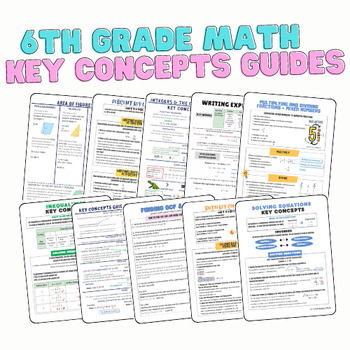
6th Grade Math: Key Concepts Guides/Anchor Charts BUNDLE
- Zip
Products in this Bundle (11)
showing 1-5 of 11 products
Description
Give your students the KEY to success by purchasing this key concepts guides/anchor charts bundle. This bundle is a MUST HAVE resource for 6th grade classrooms and would also be a great one for 7th grade classrooms to have the important foundations to grow their knowledge!
This bundle includes guides for ALMOST ALL 6th grade common core standards with just a few that are not addressed such as multiplying and dividing decimals using standard algorithm.
Purchasing as a bundle saves you $7.50!
The topics included in this bundle are:
1. Statistics: Statistical questions, mean, median, mode, range, IQR, 5-number summary, box-and-whisker plots, stem-and-leaf plots, histograms, outliers, and shape distribution
2. Solving and Writing Equations
3. Solving and Graphing Inequalities
4. Writing, Evaluating, and Simplifying Algebraic Expressions
5. Integers and the Coordinate Plane
6. Ratios: Solving ratio problems, unit rate, ratio tables
7. Percent: solving for part and whole + converting fractions to percent
8. Multiplying and Dividing Fractions + converting fractions to mixed numbers
9. GCF/LCM, Prime Factorization, + Exponents
10. Area of Figures + Composite Figures
11. Order of Operations + Exponents + two pages of practice!
As a teacher, I know the struggles of making sure students come prepared with their notes or take notes that are legible and usable. This is why I started to create cohesive resources of my own that students use for reference in my classroom and man has it made all of the difference! After creating this resource I have seen huge increases in assessment scores as students had a consistent resource to help them understand key definitions and provide a visual and example for each big idea. I have even had my administrators reaching out to me to understand how the scores of my students were much superior to those of their peers!
If you love this key concepts guide, please check out my other resources, rate me, and comment on any other needs or suggestions you have! I would love to hear from you!
Thank you for your support!


