61 results
6th grade statistics laboratories for GATE
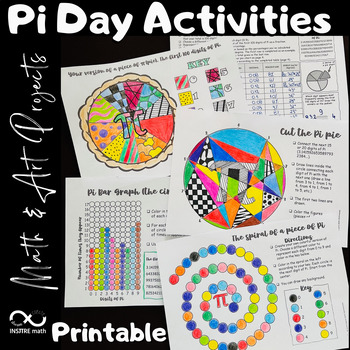
4 Pi Day Math Activities | Math & Art Projects | Coloring Circles | Pie Chart
4 Math & Art Projects to celebrate Pi Day that include circles and Pi exploration! Your students will love these Pi Day activities! Let your students express themselves using these hands-on Math & Art resources during the exploration of Pi.Content:- Your version of a piece of π (pie). The first 100 digits of Pi. Frequency Pie Chart.- Pi Bar Graph - the circular version.- The spiral of a piece of Pi.- Cut the Pi pie.This resource includes:- The editable PowerPoint™ version.- The printable
Subjects:
Grades:
4th - 8th
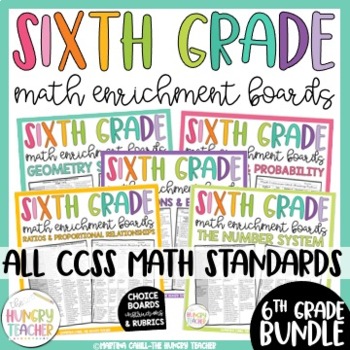
Math Enrichment Choice Board Sixth Grade for Ratios Statistics Number System
This resource includes math enrichment choice boards, rubrics, and instructions for every single 6th grade math Common Core State Standard for ratios, proportional relationships, expressions and equations, statistics and probability, geometry, and the number system. These are great for early finishers and students who need enrichment in math. Included in this pack are the math enrichment boards I use for my sixth grade learners who have mastered any of our math concepts and are now ready for a c

Candy Probability: Discovery of EXPERIMENTAL vs. THEORETICAL Probability
Middle Schoolers LOVE probability!
This is a GREAT lesson around Halloween when the kids are already hyped up on sugar and want to 'talk' to their classmates.
This activity allows the students to DISCOVER the differences between EXPERIMENTAL and THEORETICAL probability and connect it to everyday experiences. The probability lesson lends itself to fractions, decimals, percents, data collection, rational & irrational numbers, statistical graphs (box and whiskers, frequency tables...), measu
Subjects:
Grades:
5th - 9th
Types:
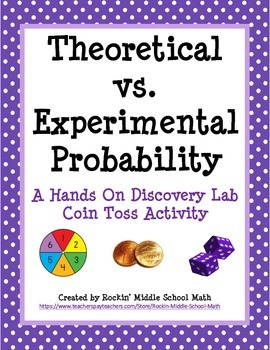
Theoretical vs Experimental Probability Lab (includes making predictions)
This is a fun, student-centered activity in which students working with a partner will conduct an experimental lab tossing 2 coins. After completing the lab, they will draw conclusions based upon the results of the activity concerning the difference between theoretical and experimental probability. Then they use experimental probability to make predictions. I have included the lab activity, a follow-up worksheet which can be used to engage student discussion after the lab, and a worksheet for
Subjects:
Grades:
6th - 9th
Types:
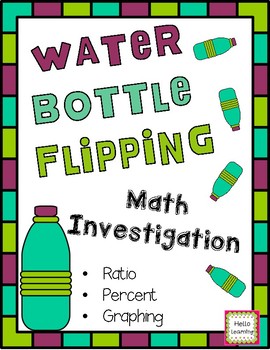
Water Bottle Flipping Investigation
Water bottle flipping- ratio, percent, measurement, data collection and graphing! The kids love bottle flipping and this product will let you bring bottle flipping into your classroom in an educational way!
Students will make predictions about the ideal water level in their water bottle that will result int he most successful flips. They will then record data about their bottle and conduct a variety of trials using different water levels to test their success with flipping their bottle at d
Subjects:
Grades:
5th - 7th
Types:
12 Days of Christmas: A Computer Spreadsheet Activity
This great holiday activity shows students how to use a computer spreadsheet to calculate the cost of their true love's gifts in today's dollars.The simple step-by-step procedure will allow both beginning and computer-savvy students to experience success as they learn how to use spreadsheet software. Students will enjoy the engaging and entertaining activity. No computer? No problem! Use the activity master so students can calculate the costs themselves.
Grades:
5th - 9th
Types:
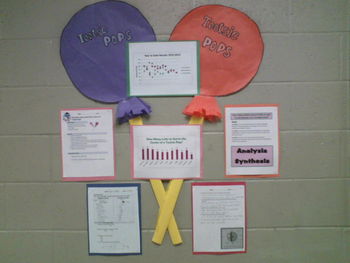
How Many Licks to the Center of a Tootsie Pop? Statistics!
Looking for novel way to get your middle school students excited about math and statistics?!
This file contains everything you need to conduct the experiment (except the Tootsie Pops!) that answers the age old question "How many licks does it take to get the center of a tootsie pop?" The lesson covers mean, median, mode, range, outliers, tables, graphs, box and whisker plots, data collection, pre and post discussion questions, experimental procedures, and student reflection. I also provided a s
Subjects:
Grades:
6th - 9th
Types:
Spring into Statistics Data Displays and Measures of Center Lab
This is a hands-on lab that teaches about Statistical Questions, Data Displays (dot/line plot, histograms, box plots) and Measures of Center (mean, median, mode, and range). The lab includes notes pages, examples with answer keys, and a final project in which the student can survey classmates and create a "flower" by using their data to find mean, median, mode, range. They will also create a box plot, histogram and dot plot.

Statistics Survey Project - Project Based Learning (PBL) with Math
Watch your students dive into the world of math as they create, execute, and analyze their own survey! Students will demonstrate mastery of data gathering, survey sampling, developing appropriate survey questions, data tables, Direct Variation, discrete graphs, dot plots, box and whisker graphs, and calculating the inter-quartile range.The Unique Survey Project is highly engaging, capitalizing on the innate curiosity of the adolescent mind. You will love the low-prep instructional guide. Your st
Subjects:
Grades:
6th - 10th
Types:
Also included in: Fun with Ratios Activities Bundle - 7th Grade PBL with Math
What's the Verdict: Sharks vs. Lightning? Modes of Center, Spread, and More!
Put it to the test! Use the age-old expression: "You are more likely to get struck by lightning than to be bitten by a shark!" to learn and practice Measures of Center, Measures of Spread, Measures of Shape, and Statistical Graphing including:MEANMEDIANMODERANGEOUTLIERS [Using IQR +/- 1.5(IQR)]QUARTILES [lower quartile (IQ-1) and upper quartile (IQ-3)]INTERQUARTILE RANGE (IQR)MEAN ABSOLUTE DEVIATION/ M.A.D. ft. ABSOLUTE VALUESYMMETRY/ASYMMETRY OF DISTRIBUTIONCLUSTERS AND GAPSBELL SHAPED CURVE AN
Subjects:
Grades:
5th - 12th, Higher Education, Adult Education
Types:
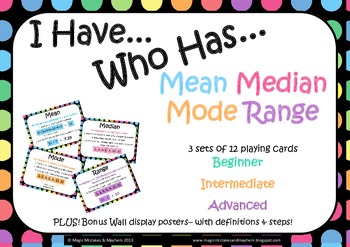
Mean, Median, Mode, Range "I Have Who Has" Game
A GREAT, FUN WAY FOR KIDS TO PRACTICE AND REINFORCE THEIR SKILLS IN THIS TRICKY TO REMEMBER AREA!3 DIFFERENT LEVELS! This pack includes 36 cards for the game "I Have Who Has" with a focus on Mean, Median, Mode and Range. The cards are split into three levels to be played in small groupsBeginner (green cards)Intermediate (orange cards)Advanced (purple cards)The aim of the game is to quickly work out the problem on your card so that when some one asks "who has...." if it is you then you can answe
Subjects:
Grades:
4th - 7th
Intro to Statistics Dice Game (with brief lesson)
This is designed to give students a very basic introduction to the world of statistics. They do not need any special knowledge to participate. After giving students a brief lesson how how statistics work, they will have fun experimenting with various dice games. This is fun for both students and teachers. Anyone can do it for any math class!
Subjects:
Grades:
6th - 8th
Types:
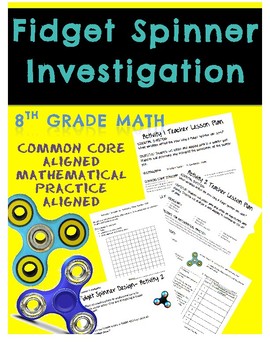
Fidget Spinner Math Investigation Scatter Plots and Data Displays
This pack contains two awesome activities involving the latest fad that is driving teachers CRAZY in middle school classrooms: FIDGET SPINNERS:
TWO Activities are contained in this pack!
Activity 1 is geared towards 8th grade students who have already studied scatter plots and interpreting correlations. In this activity students will collect data and compare the weight and time spinning of a fidget spinner. Materials required: scale, stop watch, and of course fidget spinners!
Activity 2 can b
Subjects:
Grades:
6th - 9th
Types:
CCSS:
Basketball Statistics Project
Description: Engage your middle school students in the exciting world of basketball while reinforcing math and data analysis skills with this interactive Basketball Stats Project! This comprehensive resource is designed to captivate students' interest in both sports and mathematics, making learning both fun and meaningful.Take your students to the gym or outdoor playground hoop and they'll collect data on "How many baskets can ___ graders make in 60 seconds?" (the template is set to sixth grade
Subjects:
Grades:
5th - 8th
Types:
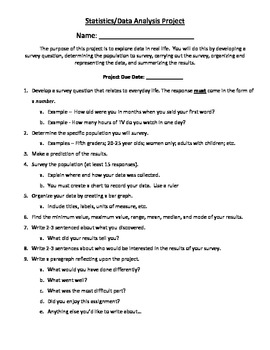
Real-Life Statistics Project
Students must think of a survey question that can be answered numerically. Then, they must go out into their community or school and ask at least 15 people their question. After collecting their data, they must find the minimum, maximum, range, mean, median, and mode. Also, they must graph their results, and answer a few reflection questions about their data.
I have my kids put all of this information on a poster or make a powerpoint presentation to show the class. I find this activity re
Subjects:
Grades:
4th - 8th
Types:
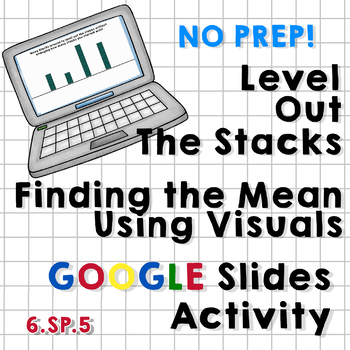
Level Out the Stacks - Finding Mean Using Visuals - Google Slides Activity
This Google Slides Activity includes 25 unique slides that help students to find the mean of a set of data using visuals first (stacks of blocks of varying heights), then eventually proving their answer by performing the actual calculations.
The slides become moderately more difficult as students progress through the activity, ending with several decimal problems where the cubes they're working with are split into fourths and the calculated mean is a decimal.
The slides are easy to duplicate
Subjects:
Grades:
5th - 7th
Types:
CCSS:
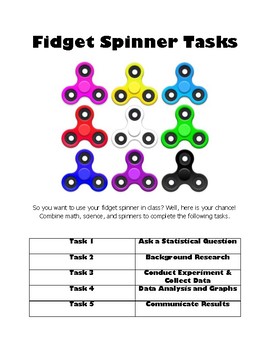
Fidget Spinner Tasks
This 5 part lesson combines math, science, and the fidget spinner craze! The five tasks incorporate 6th and 7th grade common core math standards in statistics and some geometry (area/circumference), along with the scientific method and writing.
Task 1: Ask a statistical question
-Includes identifying independent and controlled variables to design experiment fairly
Task 2: Background Research
-Includes drawing, describing qualities, calculating circumference and area of two circles, and weighing
Subjects:
Grades:
6th - 7th
Types:
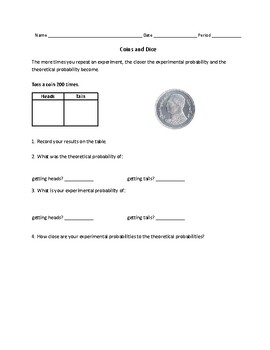
Pennies and Dice Probability Experiment - Statistics, Probability, and Data #9
In this hands-on activity, students will flip a coin and roll a six-sided die 200 times each to see if the results of their tests matches up with the hypothetical probability of each result.If you don't have coins or dice, there are online virtual versions of coins and dice.Assignment fits on one double-sided sheet.
Subjects:
Grades:
6th - 8th
Types:
Also included in: Middle School Statistics, Probability, and Data Bundle
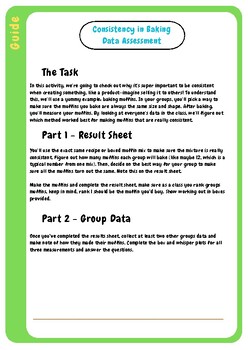
Consistency in Baking: A Data Story
This is a guide on how to use the consistency in baking results & group sheets. This is a statistics assessment:5 number summarymeanrange & IQRStandard deviationbox and whisper plotsYou don;t need to use this as an assessment but it's a great way to teach the importance of data and how it's useful in a commercial setting. This practical will also help students understand mean and standard deviation. i find that students know how to calculate mean, median and mode but no matter how many t
Subjects:
Grades:
6th - 10th
Types:
Probability Carnival Project
Using Mr. Naussbaum's probability fair website (a free, typically unblocked, math game), Students will play common carnival games and use the slides to answer questions about the probability of outcomes.
Subjects:
Grades:
6th - 8th
Types:
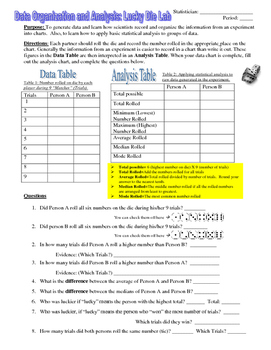
Data Organization and Statistical Analysis Activity: Lucky Die Lab
An engaging way for students to learn about how scientists generate data and make meaning of that data using statistical tools. Featured Concepts:Data Organization in TablesData Analysis Using Measures of Central Tendency: Mean, Median and Mode. NGSS Science and Engineering Practice: Using mathematics and computational thinkingMaterials needed in addition to the handouts: Dice (one per student dyad)Includes bonus second page featuring analysis of experimental design, with opportunities for fur
Subjects:
Grades:
5th - 8th
Types:
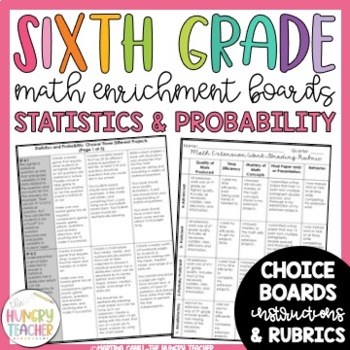
Math Enrichment Board for Statistics and Probability Sixth Grade | Choice Board
Included in this pack is the sixth grade math enrichment boards I use for my sixth grade learners who have mastered any of our statistics and probability math concepts and are now ready for a challenge. These choice boards give students choice, ownership, and a challenge through focused standard based projects. Included in this pack are the math enrichment boards I use for my sixth grade learners who have mastered Statistics and Probability concepts and are now ready for a challenge. There are t
Subjects:
Grades:
6th
Types:
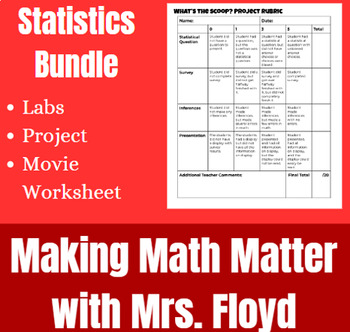
Statistics Activities Bundle
This bundle has 2 labs, 1 project, and a movie worksheet to Luca.
Subjects:
Grades:
6th - 10th
Types:
Fidget Spinners: Math in Motion
If a fidget spinner is better at holding a student’s interest than my math lesson, it’s not the fidget spinner than needs to go! Let’s use them to help the students see the math in their everyday life math in a fun and engaging way. Students will gather and interpret data, convert measurements of time, graph data, and even use online software if you wish.As a “S.T.E.M. in Action” lesson, you’ll find all four components of a true S.T.E.M. curriculum represented.Science — Students design an experi
Subjects:
Grades:
6th - 9th
Types:
Showing 1-24 of 61 results


