
18 results
6th grade statistics resources for GATE


4 Pi Day Math Activities | Math & Art Projects | Coloring Circles | Pie Chart
4 Math & Art Projects to celebrate Pi Day that include circles and Pi exploration! Your students will love these Pi Day activities! Let your students express themselves using these hands-on Math & Art resources during the exploration of Pi.Content:- Your version of a piece of π (pie). The first 100 digits of Pi. Frequency Pie Chart.- Pi Bar Graph - the circular version.- The spiral of a piece of Pi.- Cut the Pi pie.This resource includes:- The editable PowerPoint™ version.- The printable
Subjects:
Grades:
4th - 8th

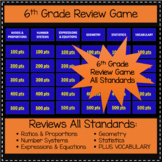
Math Enrichment Choice Board Sixth Grade for Ratios Statistics Number System
This resource includes math enrichment choice boards, rubrics, and instructions for every single 6th grade math Common Core State Standard for ratios, proportional relationships, expressions and equations, statistics and probability, geometry, and the number system. These are great for early finishers and students who need enrichment in math. Included in this pack are the math enrichment boards I use for my sixth grade learners who have mastered any of our math concepts and are now ready for a c

12 Days of Christmas: A Computer Spreadsheet Activity
This great holiday activity shows students how to use a computer spreadsheet to calculate the cost of their true love's gifts in today's dollars.The simple step-by-step procedure will allow both beginning and computer-savvy students to experience success as they learn how to use spreadsheet software. Students will enjoy the engaging and entertaining activity. No computer? No problem! Use the activity master so students can calculate the costs themselves.
Grades:
5th - 9th
Types:

Statistics Survey Project - Project Based Learning (PBL) with Math
Watch your students dive into the world of math as they create, execute, and analyze their own survey! Students will demonstrate mastery of data gathering, survey sampling, developing appropriate survey questions, data tables, Direct Variation, discrete graphs, dot plots, box and whisker graphs, and calculating the inter-quartile range.The Unique Survey Project is highly engaging, capitalizing on the innate curiosity of the adolescent mind. You will love the low-prep instructional guide. Your st
Subjects:
Grades:
6th - 10th
Types:
Also included in: Fun with Ratios Activities Bundle - 7th Grade PBL with Math

What's the Verdict: Sharks vs. Lightning? Modes of Center, Spread, and More!
Put it to the test! Use the age-old expression: "You are more likely to get struck by lightning than to be bitten by a shark!" to learn and practice Measures of Center, Measures of Spread, Measures of Shape, and Statistical Graphing including:MEANMEDIANMODERANGEOUTLIERS [Using IQR +/- 1.5(IQR)]QUARTILES [lower quartile (IQ-1) and upper quartile (IQ-3)]INTERQUARTILE RANGE (IQR)MEAN ABSOLUTE DEVIATION/ M.A.D. ft. ABSOLUTE VALUESYMMETRY/ASYMMETRY OF DISTRIBUTIONCLUSTERS AND GAPSBELL SHAPED CURVE AN
Subjects:
Grades:
5th - 12th, Higher Education, Adult Education
Types:

Mean, Median, Mode, Range "I Have Who Has" Game
A GREAT, FUN WAY FOR KIDS TO PRACTICE AND REINFORCE THEIR SKILLS IN THIS TRICKY TO REMEMBER AREA!3 DIFFERENT LEVELS! This pack includes 36 cards for the game "I Have Who Has" with a focus on Mean, Median, Mode and Range. The cards are split into three levels to be played in small groupsBeginner (green cards)Intermediate (orange cards)Advanced (purple cards)The aim of the game is to quickly work out the problem on your card so that when some one asks "who has...." if it is you then you can answe
Subjects:
Grades:
4th - 7th

Level Out the Stacks - Finding Mean Using Visuals - Google Slides Activity
This Google Slides Activity includes 25 unique slides that help students to find the mean of a set of data using visuals first (stacks of blocks of varying heights), then eventually proving their answer by performing the actual calculations.
The slides become moderately more difficult as students progress through the activity, ending with several decimal problems where the cubes they're working with are split into fourths and the calculated mean is a decimal.
The slides are easy to duplicate
Subjects:
Grades:
5th - 7th
Types:
CCSS:

Math Enrichment Board for Statistics and Probability Sixth Grade | Choice Board
Included in this pack is the sixth grade math enrichment boards I use for my sixth grade learners who have mastered any of our statistics and probability math concepts and are now ready for a challenge. These choice boards give students choice, ownership, and a challenge through focused standard based projects. Included in this pack are the math enrichment boards I use for my sixth grade learners who have mastered Statistics and Probability concepts and are now ready for a challenge. There are t
Subjects:
Grades:
6th
Types:

Array We Go! Introducing Multiplication, Factors, Primes, & Composites
This is an engaging and visual way to introduce multiplication and the concepts of factors, multiples, primes, composites and MORE! Students build arrays for the numbers 1–25 and look for patterns and characteristics that help them learn to recognize multiples. Directed questions also help them to learn to identify primes and composites. Square numbers, factor rich numbers, and perfect numbers are included for more advanced students.
Extensions allow you to take the lesson to a multi-day in dept
Subjects:
Grades:
3rd - 6th

Paper Plates Pie Charts: It's As Easy as Pie!
This activity allows students to analyze data and draw conclusions about data without spending inordinate amounts of time creating the graphs. Students will be able to quickly create accurate pie charts that can be used for critical thinking activities. Two versions are explained, one which will work for any sample size, and a second simpler method that does not require rigorous calculations to determine the degree measures. Four copy masters are included so you don't even have to buy paper pla
Subjects:
Grades:
4th - 7th

Probability Math Project
The Probability Project is great for students 4th-6th grades. Students survey friends and family to gather data and use it to practice and learn probability. Students will learn how to calculate mean, median, mode, and draw charts. Packet includes helpful information sheets and flashcards for students to use and learn. This is an engaging and comprehensive project your student will love!Subjects: Math, Writing, and ArtGrades: 4th-6thAges: 8-12 years oldDuration of Project: 2 weeksPages: 21Please
Subjects:
Grades:
4th - 6th
Types:
Also included in: 2nd-6th Grade Bundle

✏️ Statistics & Probability Performance Tasks
There are 4 separate performance tasks in this Google Drive Folder! You can work on them with your students, have them work in groups, or give it as an assessment! These are great problems that ensure even greater classroom conversations!
Subjects:
Grades:
6th - 8th
Types:
Also included in: ✏️ 6th Math Performance Task BUNDLE

A Sweet Introduction to Probability
Students will be introduced to probability and graphing including:1) Making a bar graph2) Making a circle graph3) Making a line graph4) Forming a fraction based on data5) Convert a fraction to a decimal and percent6) Learn how to find the mean, median, and mode for average7) State the probability of finding a yellow candy in a bag
Subjects:
Grades:
6th
Types:

A Fun Introduction to Probability
This product contains fourteen pages that introduce probability by graphing the LEGOs and comparing the number of studs on LEGO bricks. These statistics will be figured in fractions, decimals and percentages. Graphing will be done on bar graphs and pie graphs. The worksheets are colorful and engaging for students. Students will learn to find the mean, median and mode of different numbers of studs on LEGO bricks. Students will find their own statistics and combine them with the statistics of ot
Subjects:
Grades:
4th - 9th

Probability R.A.F.T. - Critical Thinking Activity
Engage your students in showing what they know about probability through this R.A.F.T. activity. Students select one role, audience, format, and topic for their writing. They may mix and match between the rows, and may always complete more than one activity! My gifted students love these activities that allow them to exercise their creativity!
Happy Teaching!
Subjects:
Grades:
3rd - 6th
Types:

Using Data to Support a Hypothesis
In this math challenge, students must create a hypothesis and then collect and display data to support their hypothesis!

Scientific Math Minds
A math based science experiment outline in power point form. The slides guide students in selecting a question based on the population of their school for a social science project. Data collection and organization as well as sample surveys and scientific method is represented.
Subjects:
Grades:
4th - 6th
Types:

✏️ Statistics Performance Task FREEBIE!
You can work on them with your students, have them work in groups, or give it as an assessment! These are great problems that ensure even greater classroom conversations!
Subjects:
Grades:
6th - 8th
Types:
CCSS:
Showing 1-18 of 18 results

TPT is the largest marketplace for PreK-12 resources, powered by a community of educators.
IXL family of brands