48 results
8th grade statistics outlines for GATE
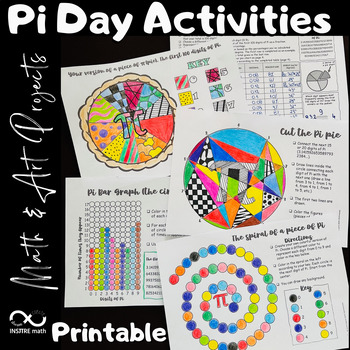
4 Pi Day Math Activities | Math & Art Projects | Coloring Circles | Pie Chart
4 Math & Art Projects to celebrate Pi Day that include circles and Pi exploration! Your students will love these Pi Day activities! Let your students express themselves using these hands-on Math & Art resources during the exploration of Pi.Content:- Your version of a piece of π (pie). The first 100 digits of Pi. Frequency Pie Chart.- Pi Bar Graph - the circular version.- The spiral of a piece of Pi.- Cut the Pi pie.This resource includes:- The editable PowerPoint™ version.- The printable
Subjects:
Grades:
4th - 8th
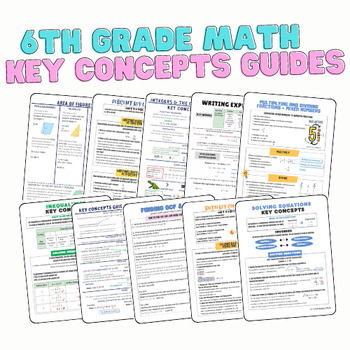
6th Grade Math: Key Concepts Guides/Anchor Charts BUNDLE
Give your students the KEY to success by purchasing this key concepts guides/anchor charts bundle. This bundle is a MUST HAVE resource for 6th grade classrooms and would also be a great one for 7th grade classrooms to have the important foundations to grow their knowledge! This bundle includes guides for ALMOST ALL 6th grade common core standards with just a few that are not addressed such as multiplying and dividing decimals using standard algorithm.Purchasing as a bundle saves you $7.50!The to
12 Days of Christmas: A Computer Spreadsheet Activity
This great holiday activity shows students how to use a computer spreadsheet to calculate the cost of their true love's gifts in today's dollars.The simple step-by-step procedure will allow both beginning and computer-savvy students to experience success as they learn how to use spreadsheet software. Students will enjoy the engaging and entertaining activity. No computer? No problem! Use the activity master so students can calculate the costs themselves.
Grades:
5th - 9th
Types:

Statistics Survey Project - Project Based Learning (PBL) with Math
Watch your students dive into the world of math as they create, execute, and analyze their own survey! Students will demonstrate mastery of data gathering, survey sampling, developing appropriate survey questions, data tables, Direct Variation, discrete graphs, dot plots, box and whisker graphs, and calculating the inter-quartile range.The Unique Survey Project is highly engaging, capitalizing on the innate curiosity of the adolescent mind. You will love the low-prep instructional guide. Your st
Subjects:
Grades:
6th - 10th
Types:
Also included in: Fun with Ratios Activities Bundle - 7th Grade PBL with Math
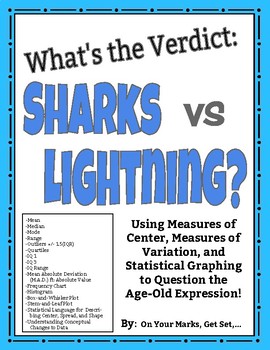
What's the Verdict: Sharks vs. Lightning? Modes of Center, Spread, and More!
Put it to the test! Use the age-old expression: "You are more likely to get struck by lightning than to be bitten by a shark!" to learn and practice Measures of Center, Measures of Spread, Measures of Shape, and Statistical Graphing including:MEANMEDIANMODERANGEOUTLIERS [Using IQR +/- 1.5(IQR)]QUARTILES [lower quartile (IQ-1) and upper quartile (IQ-3)]INTERQUARTILE RANGE (IQR)MEAN ABSOLUTE DEVIATION/ M.A.D. ft. ABSOLUTE VALUESYMMETRY/ASYMMETRY OF DISTRIBUTIONCLUSTERS AND GAPSBELL SHAPED CURVE AN
Subjects:
Grades:
5th - 12th, Higher Education, Adult Education
Types:
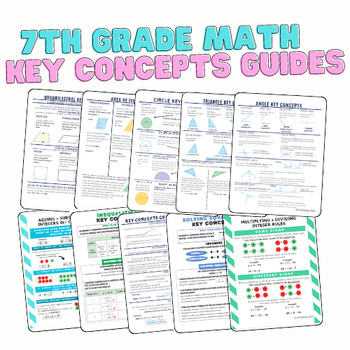
7th Grade Key Concepts Guides/Anchor Charts: BUNDLE
Give your students the KEY to success by purchasing this key concepts guides/anchor charts bundle. This bundle is a MUST HAVE resource for 7th grade classrooms and would also be a great one for 8th grade classrooms to have the important foundations to grow their knowledge!Purchasing as a bundle saves you $7.00!The topics included in this bundle are:1. Adding and Subtracting Integers2. Multiplying and Dividing Integers3. Solving and Writing Equations4. Solving and Graphing Inequalities5. Circles:
Subjects:
Grades:
6th - 8th
Types:
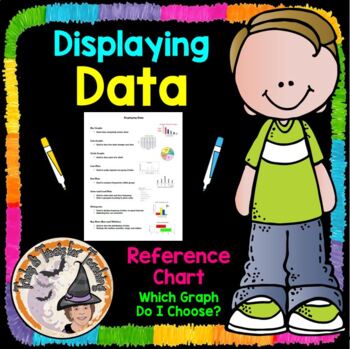
Displaying Data Reference Chart Notes Which Graph Do I Choose?
Math Teachers ~ You'll LOVE this Displaying-Data, Which-Graph-Do-I-Choose? Data-Display Reference-Chart will be SUPER helpful to your students in helping them determine which graph to choose, and provides a quick visual picture to remind them what that particular graph looks like. I printed one of these for each of my students to put inside their Math Toolkit Notebook, to use as a Reference for Data Displays Charts and Graphs. You'll enjoy using this year after year!Be sure to L@@K at my other 1
Subjects:
Grades:
5th - 8th

Fun with Ratios Activities Bundle - 7th Grade PBL with Math
The purpose of the Fun with Ratios Activities Bundle is to give students the opportunity to use creativity to apply ratios, proportions, and percentages in real-world settings. This bundle includes three unique tasks: Black Friday Mastery Task, Direct Variation Poster Mastery Task, and the Unique Survey Project. These activities and their accompanying materials are suited for students in grades 7 through 9. These lessons make excellent sub plans. Each project takes approximately two 60-minute bl
Subjects:
Grades:
7th - 9th
Types:
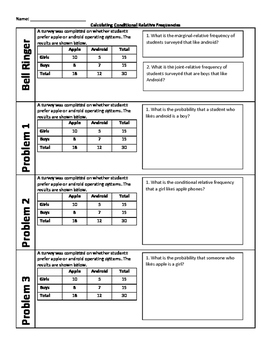
Conditional Relative Frequency (Guided Notes + Stations + Exit Ticket)
This resource contains guided notes on calculating conditional relative frequency for a two-way frequency table that presents interesting information for students. The guided notes are followed by 8 stations with a recording sheet, that asks students questions about conditional frequencies as well as joint and marginal frequencies for review purposes. These stations can be used the same day as the guided notes, or on another day for review. Also included is an exit ticket that focuses on conditi
Subjects:
Grades:
8th - 9th
Types:
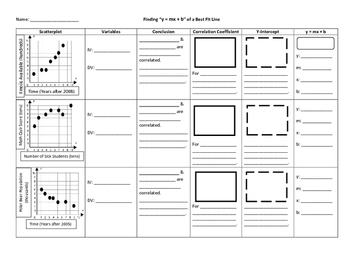
Best Fit Line Equations (Guided Notes/Practice)
These 3 problems are perfect for introducing students to finding the linear equation of a best fit line. The problems ensure students understand the meaning behind the correlation coefficient and the y-intercept. This helps students realize the importance of the linear equation. The extensive problems help review concepts that are important for successfully writing a y = mx + b equation for a best fit line.The answer key provides the exemplar for problem #1. If you want all students getting the
Subjects:
Grades:
8th - 9th
Also included in: Scatterplots Bundle (Weeks of Products!)
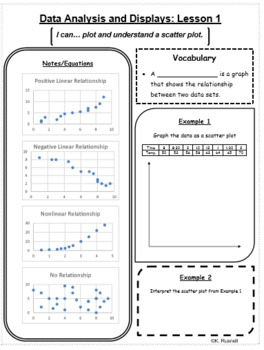
Data Analysis and Displays Notes
These guided notes are created to help differentiate and guide instruction for the math curriculum. This set of notes has been written based off of 8th grade standards and follows the Big Ideas Curriculum, but can be used for similar grades. Each page of notes includes an "I can" statement, vocabulary, student notes, step-by-step guides, examples, and story problems. Each notes is reduced to one page for quick reference. The vocabulary cards that go along with the vocabulary within the notes can
Subjects:
Grades:
6th - 10th
Types:
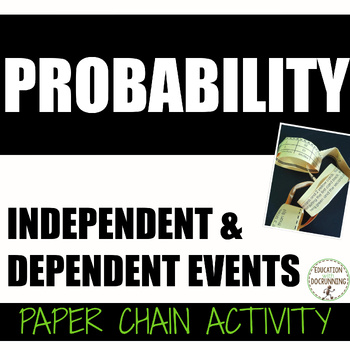
Probability Independent and Dependent Events Activity Paper Chain
Engage students at centers or in partners with this Probability Independent and Dependent Events Paper Chain Activity. Students solve probability questions involving tables, word problems, and diagrams. One link which leads to the answer on the next link. My students LOVE this activity. This resource includes:- Paper chain links with Probability problems- Answer key- Teacher's guide.A great addition to your middle school math curriculum and for differentiation.Also available in money-saving
Subjects:
Grades:
7th - 9th
Types:
CCSS:
Also included in: 7th Grade Math Activities Paper Chains Bundle
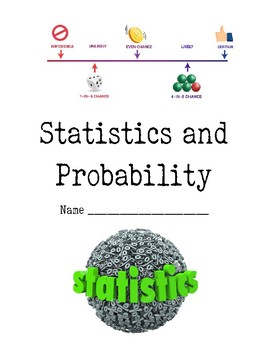
7th Grade Common Core Probability and Statistics Unit
Probability and Statistics Unit for 7th Grade Math Common Core
Lessons include:
Mean, Median, Mode, and Range
When to Use Each Measure
Mean Absolute Deviation - How to Calculate
Mean Absolute Deviation - Analysis
Sampling and Biased Surveys
Making Predictions from Survey Results
Simple Probability (Single Event)
Compound Probability - Independent Events
Compound Probability - Dependent Events
Subjects:
Grades:
6th - 8th
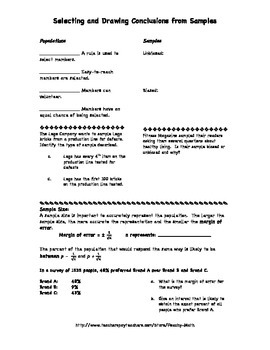
Statistical sampling and questioning of populations
This worksheet was created to review section 11.4 Select and Draw Conclusions from Samples in McDougal Little Algebra 2. It reviews the following concepts:
Population
Samples
Self-Selected Sample
Systematic Sample
Convenience Sample
Random Sample
Unbiased Sample
Biased Sample
Margin of error
Subjects:
Grades:
8th - 11th
CCSS:
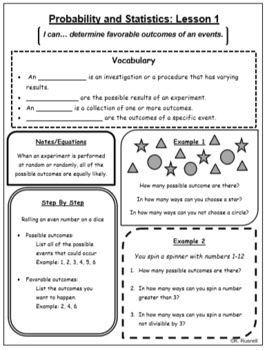
Probability and Statistics
These guided notes are created to help differentiate and guide instruction for the math curriculum. This set of notes has been written based off of 7th grade standards and follow the Big Ideas Curriculum, but can be used for similar grades. Each page of notes includes an "I can" statement, vocabulary, student notes, step-by-step guides, examples, and story problems. Each notes is reduced to one page for quick reference. The vocabulary cards that go along with the vocabulary within the notes can
Subjects:
Grades:
6th - 8th
Types:
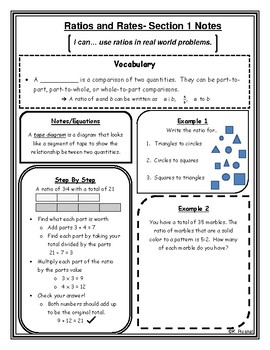
Ratios and Rates Notes
These guided notes are created to help differentiate and guide instruction for the math curriculum. This set of notes has been written based off of 6th grade standards, but can be used for similar grades. Each page of notes includes an "I can" statement, vocabulary, student notes, step-by-step guides, examples, and story problems. Each notes is reduced to one page for quick reference. The vocabulary cards that go along with the vocabulary within the notes can be found on my page as, "Math Vocabu
Subjects:
Grades:
5th - 8th
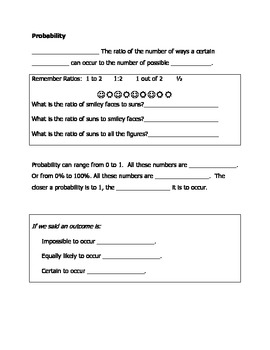
Interactive Notebook Probability Guided Notes: Theoretical vs Experimental
Guided notes discussing the concepts of Probability as a ratio, fraction, and percent. Further discussion compares Theoretical and Experimental Proability, the definitions, and forumulas to calculate. For 5th - 8th grade general education or special education classrooms. Great for your interactive notebooks.
Subjects:
Grades:
4th - 9th
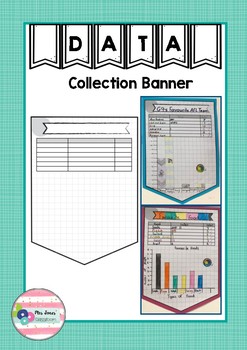
Data Collection Banner
Are your students collecting their own data and representing it using a graph this term? Then why not get them presented on this banner pendant and display them in your room.
Subjects:
Grades:
1st - 10th
Types:
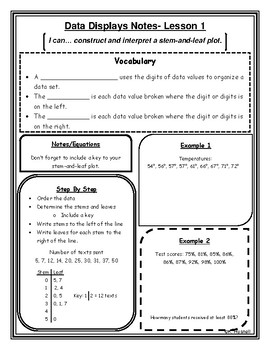
Data Displays Notes
These guided notes are created to help differentiate and guide instruction for the math curriculum. This set of notes has been written based off of 6th grade standards, but can be used for similar grades. Each page of notes includes an "I can" statement, vocabulary, student notes, step-by-step guides, examples, and story problems. Each notes is reduced to one page for quick reference. The vocabulary cards that go along with the vocabulary within the notes can be found on my page as, "Math Vocabu
Subjects:
Grades:
5th - 8th
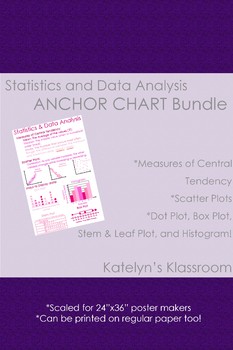
Statistics & Data Analysis Anchor Chart
Perfect anchor chart to help your students process Algebraic concepts. Scaled to print to a 36"x24" poster on a poster maker, but can be printed on a regular size piece of paper too! Allows your students to focus on the topics at hand and have examples to guide their learning!Buy an individual anchor chart, or buy the bundle with all of the algebra concepts!Concepts included on this chart:*Measures of Central Tendency*Scatterplots*Box Plot*Dot Plot*Histogram*Stem & Leaf Plot
Subjects:
Grades:
7th - 12th
Also included in: Algebra Anchor Chart BUNDLE!
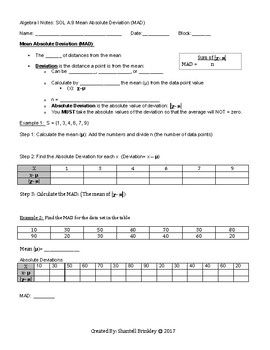
Mean Absolute Deviation (MAD) Notes
This 1 page cloze note sheet will guide students through understanding what the Mean Absolute Value is. Students will also have the opportunity to calculate the Mean Absolute Deviation for 2 sets of data points by hand. An answer key is also provided.
You are purchasing access for 1 teacher as a classroom set. The document is not to me shared with others or posted on any online venue at any time. For multiple teachers in a school please purchase the number of licenses required for a discounted
Subjects:
Grades:
6th - 12th, Higher Education, Adult Education
CCSS:
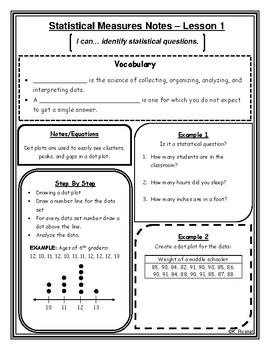
Statistical Measures Notes
These guided notes are created to help differentiate and guide instruction for the math curriculum. This set of notes has been written based off of 6th grade standards, but can be used for similar grades. Each page of notes includes an "I can" statement, vocabulary, student notes, step-by-step guides, examples, and story problems. Each notes is reduced to one page for quick reference. The vocabulary cards that go along with the vocabulary within the notes can be found on my page as, "Math Vocabu
Subjects:
Grades:
5th - 8th
✏️ Statistics & Probability Performance Tasks
There are 4 separate performance tasks in this Google Drive Folder! You can work on them with your students, have them work in groups, or give it as an assessment! These are great problems that ensure even greater classroom conversations!
Subjects:
Grades:
6th - 8th
Types:
Also included in: ✏️ 6th Math Performance Task BUNDLE
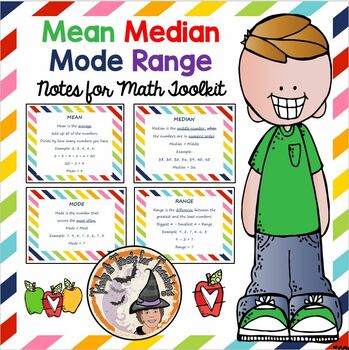
Mean Median Mode Range Notes Central Tendency Measures of Center
This Zipfile includes LOTS of goodies! You get a colorful background border notes for students for Measures of Center, Central Tendency; Mean-Median-Mode-and-Range, in 3 different sizes! The 3 pdf files are different sizes (full page sheets, half page sheets, and mini size 4 to a sheet). This allows for printing for students' Math Toolkits in whatever size you'd like. You also get a Smartboard slides of the 4 pages of colorful Notes, along with the original (4 pages) Word Document and PDF versio
Subjects:
Grades:
5th - 8th
Showing 1-24 of 48 results


