228 results
Common Core HSS-ID.A.3 pdfs

Algebra 1 Google Forms Semester 2 Digital and Printable Homework Bundle
This bundle includes all SEMESTER 2 Algebra 1 editable Google Forms homework assignments, quizzes, and tests that I have created. Every assignment also includes a "worksheet" that corresponds with the questions on each form. Just assign digitally or print + go!Not 1:1? Not using Google Classroom, yet? All of these assignments also come with a stand-alone "worksheet" that may be used with or instead of the digital resource. The SEMESTER 2 BUNDLE includes concepts within the following units:
Subjects:
Grades:
8th - 11th
Types:
CCSS:
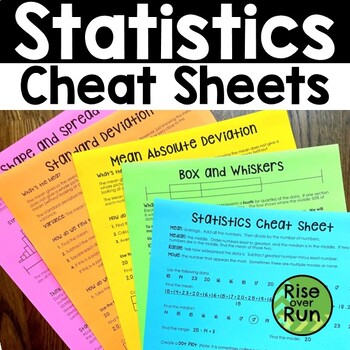
Statistics Cheat Sheets Notes with MAD, Standard Deviation, Shape & Spread
Grab these guided notes and "cheat sheets" to help your students understand statistics standards from Algebra I. Included Topics: Statistics Basics (mean, median, mode, range, dot plots, histograms, stem and leaf plots) Box and Whiskers Mean Absolute Deviation Standard Deviation Shape and Spread (Skewed Left and Skewed Right) The set includes each topic in the format of a cheat sheet and guided notes. The cheat sheets already have all the information filled in. They can be printed and given
Subjects:
Grades:
9th - 10th
Types:
CCSS:
Also included in: Algebra 1 and 8th Grade Math Curriculum Bundle for Entire Year
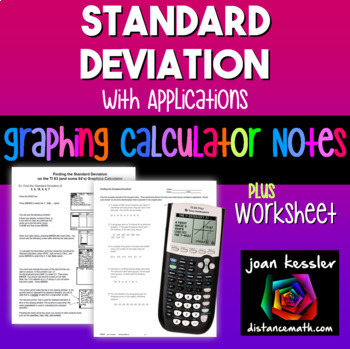
Standard Deviation on TI-84 Reference Sheets plus Practice
With this Determining the Standard Deviation on the TI 83 TI 84 Graphing Calculator plus HW step by step reference sheet your students will learn to use the graphing calculator effectively in finding the standard deviation from a data set. Use as Binder Notes or printed smaller for Interactive Notebooks.What's included?Two reference/handouts for students to learn how to find the Standard Deviation for both a population and for sample. One is for the TI 83 (yes, still in use) and the other for th
Subjects:
Grades:
8th - 11th
CCSS:

Scatter Plot Project with Real World Sports Data
Practice creating and analyzing scatter plots with these six differentiated real world projects. Students are provided statistics for a sport and must graph the data. Then, they write an analysis describing correlation, whether or not the data is linear, any outliers, and how the scatter plot might be used to make predictions. The scatterplots range from 38 points to 149 points, so they can be used to differentiate. The scatter plots will take a little time to plot, but they result in real
Subjects:
Grades:
8th - 9th
Types:
CCSS:
Also included in: 8th Grade Math Activities & Lessons Bundle for the Whole Year
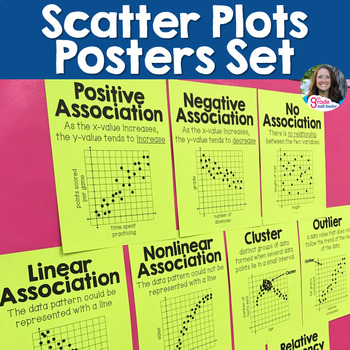
Scatter Plots and Two Way Tables Posters Set for 8th Grade Math Word Wall
Make the vocabulary visible and accessible for your students! This set of 12 printable vocabulary posters provides visuals and reminders for your students to reference during your Bivariate Data unit. Display these on your word wall while teaching scatter plots and two-way tables!The following vocabulary terms are included:scatter plotpositive association or positive correlationnegative association or negative correlationno association or no correlationlinear associationnonlinear associationoutl
Subjects:
Grades:
8th - 9th
Types:
CCSS:
Also included in: 8th Grade Math Vocabulary Posters for Word Wall - Full Year
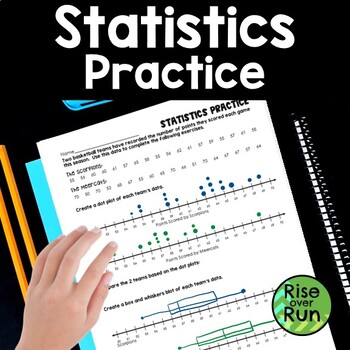
Box and Whiskers and Dot Plot Practice
Practice creating dot plots and box & whiskers plots with this statistics activity.Students are given scores for 2 basketball teams. They use the data to create a dot plot (or line plot) for each team and then a box and whiskers diagram for each team.Then, they compare the data of the teams.A bonus question asks students to calculate the mean absolute deviation.This worksheet can lead to great discussions about how to analyze box and whisker diagrams and make comparisons!
Subjects:
Grades:
6th - 7th
Types:
CCSS:
Also included in: Algebra 1 and 8th Grade Math Curriculum Bundle for Entire Year
NC Math 1 Practice End-of-Course Test (North Carolina EOC Final Exam Review)
This full length 60-item multiple choice practice test is aligned to the North Carolina Standards for Math 1. It includes 16 non-calculator active questions and 44 calculator active questions. An answer key and item/standard alignment is included for easy data analysis.
Subjects:
Grades:
7th - 10th
Types:
CCSS:
![Preview of Statistics Final Exam and Review [AP, College, and Honors]](https://ecdn.teacherspayteachers.com/thumbitem/Statisticis-FinalReviewStudy-Guide-Exam-1711356723/original-699492-1.jpg)
Statistics Final Exam and Review [AP, College, and Honors]
You can use this Statistics Final Exam in an AP Statistics, Honors Statistics, or a College Statistics course as an assessment, review or both. What's Included?Included are 6 different versions, each including 60 well chosen representative questions in both multiple choice format and also in free response format*. These reviews and tests work well in class or as a take- home. The tests are editable with Adobe Acrobat Pro. Each test should take about 2 - 3 hours and can be taken with a graphin
Subjects:
Grades:
10th - 12th, Higher Education
Types:
CCSS:
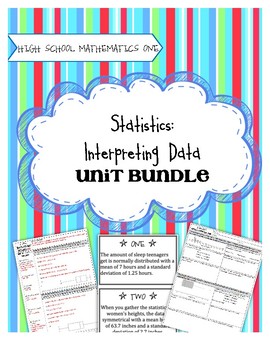
High School Math 1: Statistics and Interpreting Data
Task-Based Learning gets students intrinsically motivated to learn math! No longer do you need to do a song and dance to get kids interested and excited about learning. The tasks included in this unit, followed by solidifying notes and practice activities, will guarantee that students understand the concepts. This unit covers:
- Displaying one-variable data in a histogram, dot plot, or box plot
- Describing the distribution of data using statistical vocabulary
- Using data models and stati
Subjects:
Grades:
8th - 10th
Types:
CCSS:
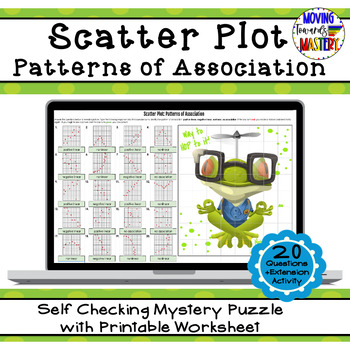
Scatter Plot: Patterns of Association Self Checking Mystery Picture
Engaging math self checking review activity to practice identifying patterns of association for scatter plots.This self-checking activity will allow students to practice identifying patterns of association for scatter plots. Students will use their understanding of scatter plots to answer questions to reveal pieces of a mystery puzzle as they work, just like a pixel art activity! If students answer incorrectly, the box will turn red and NO picture pieces will be revealed. This resource include
Subjects:
Grades:
7th - 10th
Types:
CCSS:
Also included in: 8th Grade Math Common Core Growing Bundle
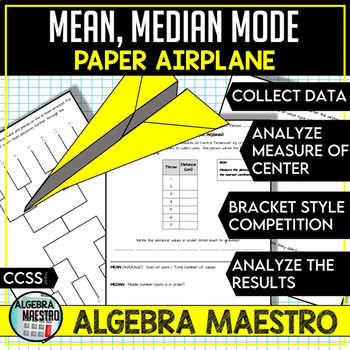
Measure of Center: Paper Airplane Activity
Students can further explore the meaning of statistical measures of center: mean, median, and mode by experimentation. This is a fun activity to explore measures of center. I use this activity with my Algebra 1 students when we start our descriptive data unit before we start talking about graphical displays (i.e. box plots, histograms, etc.). We compare measures of centers and analyze when it is appropriate to use a specific measure.Included:1. Collect data from Paper Airplane 2. Bracket t
Subjects:
Grades:
5th - 11th
Types:
CCSS:
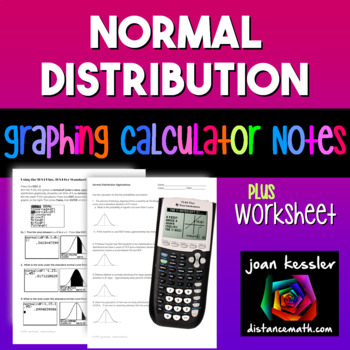
Normal Distribution | TI-84 Calculator Reference Sheet and Practice
With this Normal Distribution concise, step by step handout, your students will learn how to use the TI 83 and TI 84 Graphing Calculators to find probabilities for the Standard Normal Distribution and also find probabilities for Applications to the Standard Normal Distribution. They will also learn how to use the shade feature to construct a graph and have the calculator shade in the appropriate region.These can be used as Binder Notes or printed smaller for Interactive Notebooks.Note: This han
Subjects:
Grades:
9th - 12th
Types:
CCSS:
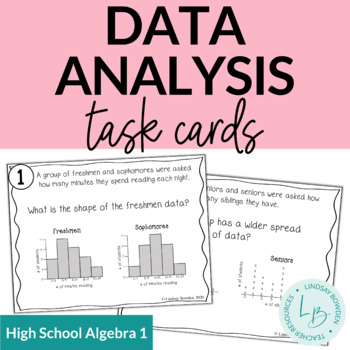
Data Analysis: Spread, Center, and Shape Task Cards
The digital version of this resource for Google Drive™ using Google Forms can be found here: Distance Learning: Data Analysis Digital Task Cards. You are able to edit this assignment using Google Forms and assign it to your students via Google Classroom.These data analysis task cards includes:comparing data of two sets using histograms, dot plots, and box and whisker plotsshape (symmetrical, skewed right, skewed left)center (mean, median)peaks (mode)spread (from looking at the graph)12 task card
Subjects:
Grades:
8th - 10th
Types:
CCSS:
Also included in: Statistics Unit Bundle
Sports Statistics & Probability curriculum workbook (130+ pages) - Project-based
WATCH THE PREVIEW CLIP! E-MAIL ME FOR DISCOUNTS OR QUESTIONS AT MEDEIROSVINNY@YAHOO.COM.Looking to start an elective math class? Interested in project-based assessments?Tired of teaching statistics with no real-world application?This 132-page interactive workbook serves as a textbook for an introductory statistics math class; complete with Common Core standards crosswalk, embedded answers, and tons of activities and mini-projects. This workbook is the only resource I use for my 'Statistical R
Subjects:
Grades:
8th - 12th
Types:
CCSS:
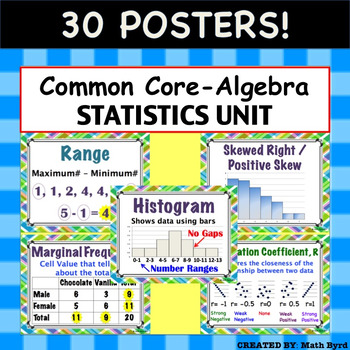
Common Core Algebra - Statistics Unit: Describing Data POSTERS
30 Posters! Each 8.5" x 11" in size. Posters are aligned with Common Core's Algebra - Statistics: Describing Data Unit. Posters Included:MeanMedianModeRangeInterquartile RangeOutlierMean Absolute DeviationMeasures of CenterMeasures of SpreadDot PlotHistogramBox PlotNormal/ Bell Shaped DistributionSkewed Right/Positive SkewSkewed Left/ Negative SkewUniform2 Way Frequency TableJoint FrequencyMarginal Frequency2 Way Relative Frequency TableConditional Relative FrequencyScatter PlotCorrelationCorrel
Subjects:
Grades:
8th - 11th
CCSS:
Also included in: Common Core Algebra 1 POSTERS - BUNDLE PRICE!
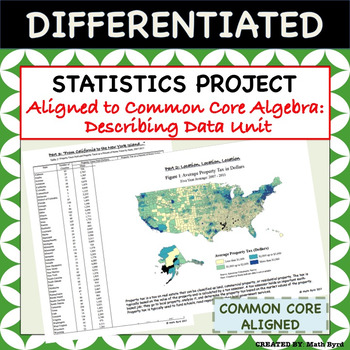
Statistics Project - Aligned to Common Core Algebra - Describing Data Unit
This differentiated U.S. Home Energy & Tax Themed Statistics Project covers all of the "describing data" standards of the Common Core Algebra Course using real data! Students will analyze various forms of tables & graphics to make inferences and interpret the data. The project is perfect for use as a summative assessment since students are required to justify their findings in open-ended format. Allow students to work in pairs, small groups, or individually! A grading rubric and selected
Subjects:
Grades:
8th - 11th
Types:
CCSS:
Also included in: Common Core Algebra 1 PROJECTS - BUNDLE PRICE!
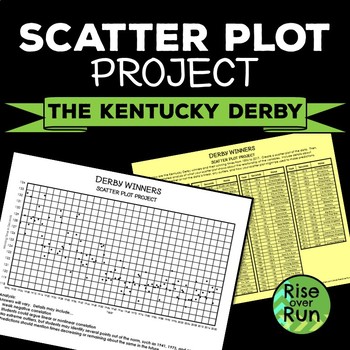
Scatterplot Project with Real World Stats from the Kentucky Derby
Practice creating and analyzing scatter plots with this project. Students are provided statistics for winning horses and must graph the data. Then, they write an analysis describing correlation, whether or not the data is linear, any outliers, and how the scatter plot might be used to make predictions. This is one of the projects in my Differentiated Scatter Plot Projects!Thank you for your interest in this resource from Rise over Run. Related Resources:Scatter Plot Practice WorksheetsScatter
Grades:
8th - 9th
Types:
CCSS:
Also included in: Algebra I Sub Plans Bundle with Activities
Common Core Math 1: Statistics Unit-5 Days of Lesson Plans!!
This unit bundle is 25% less than buying these products individually! It contains 3 teaching lessons, a test review, and test. Answer keys included for everything.
Day 1: Guided notes and worksheet on Mean, Median, and Mode and Box and Whisker Plots.
Day 2: Guided notes, activity, and worksheet on standard deviation and the effects of outliers on the mean, standard deviation, range, and interquartile range.
Day 3: Guided notes, activity, and worksheet on dot plots, histograms, tables, an
Subjects:
Grades:
8th - 11th
Types:
CCSS:

Statistics Survey Project - Project Based Learning (PBL) with Math
Watch your students dive into the world of math as they create, execute, and analyze their own survey! Students will demonstrate mastery of data gathering, survey sampling, developing appropriate survey questions, data tables, Direct Variation, discrete graphs, dot plots, box and whisker graphs, and calculating the inter-quartile range.The Unique Survey Project is highly engaging, capitalizing on the innate curiosity of the adolescent mind. You will love the low-prep instructional guide. Your st
Subjects:
Grades:
6th - 10th
Types:
Also included in: Fun with Ratios Activities Bundle - 7th Grade PBL with Math
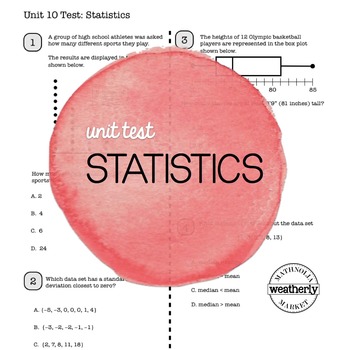
STATISTICS Unit Test CC Algebra 1
The Algebra I Common Core Unit Test will assess your students’ understanding of STATISTICS
Included topics:
Graphical Displays
Quartiles
Box Plots
Measures of Central Tendency
Variation
Two Way Frequency Tables
BiVariate Data
Linear Regression
Quantifying Predictability
Residuals
This assessment can serve as a test at the end of the unit, as a diagnostic tool prior to teaching the topics or as a “test prep” activity prior to state testing.
CCSS addressed:
N-Q.1
S-ID.1
S-ID.2
S-ID.3
S-ID.5
Subjects:
Grades:
9th - 12th
Types:
CCSS:
Also included in: Algebra 1 assessments - UNIT TEST BUNDLE
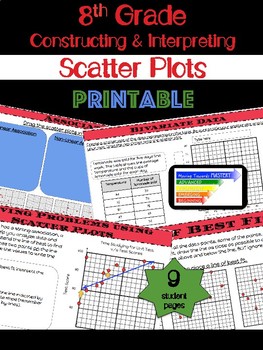
8th Grade Math Constructing & Interpreting Scatter Plots
Extensive printable lessons for constructing and interpreting scatter plots.The lessons are scaffolded to build understanding. Students will progress from identification of terms to making predictions involving bivariate data. The guided lessons will begin with identification, move towards assisted analysis, and conclude with independent practice.Lessons include...♦ Definitions and Visual Representations♦ Identification and Use of Terms → Bivariate Data → Scatter Plot → Linear, Nonli
Subjects:
Grades:
8th - 10th
Types:
CCSS:
Also included in: 8th Grade Math Common Core Growing Bundle
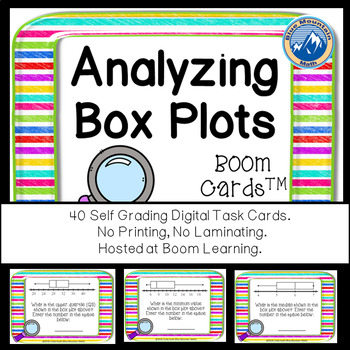
Analyzing Box Plots Boom Cards--Digital Task Cards
Boom Cards™ are a great way for students to practice skills analyzing Box Plots--formerly called Box and Whisker Plots. You can assess their understanding and students can play again to keep improving. This set uses a variety of different plots and asks question about lower quartile, upper quartile, median, interquartile range, range and outliers. This set of Boom Cards features 40 different Digital Self-Checking Task Cards. (No printing, cutting, laminating, or grading!)
Boom Cards live in the
Subjects:
Grades:
7th - 10th
Types:
CCSS:
Also included in: Algebra 1 Bundle Boom Cards--Digital Task Cards Distance Learning
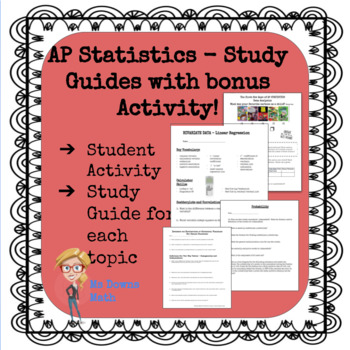
AP Statistics Study Guides - All Topics!
There is a pdf file study guide for each topic in the AP Statistics curriculum. Exploring Data, Normal Distributions, Linear Regressions, Experiments and Designing Studies, Probability, Random Variables, Sampling Distributions, Confidence Intervals, Hypothesis Tests, Comparing Populations, Chi Square Procedures, and Inference about Regression. I have students complete one for each unit. At the end of the year, they have a great study packet for the AP Exam! Student feedback has indicated that th
Subjects:
Grades:
9th - 12th, Higher Education, Adult Education
Types:
CCSS:
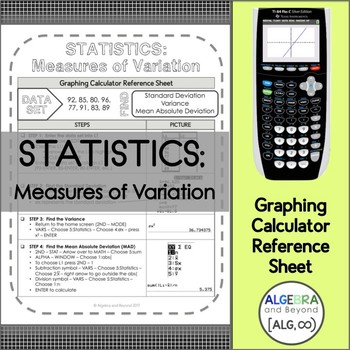
Statistics | Measures of Variation | TI-84 Graphing Calculator Reference Sheet
This graphing calculator reference sheet on measures of variation guides students step-by-step on how to create a list and find the standard deviation, variance, and mean absolute deviation.Teaching graphing calculator skills help students with: • Speed• Making connections• Checking for accuracy• Leaping hurdles*Reference sheet can be used with a TI-83 or TI-84 graphing calculator. Please look at the preview to find out more information about this resource.Check out more graphing calculator shee
Subjects:
Grades:
10th - 12th
Types:
CCSS:
Showing 1-24 of 228 results

