11 results
Common Core HSS-ID.A.3 resources for Easel
![Preview of Statistics Final Exam and Review [AP, College, and Honors]](https://ecdn.teacherspayteachers.com/thumbitem/Statisticis-FinalReviewStudy-Guide-Exam-1711356723/original-699492-1.jpg)
Statistics Final Exam and Review [AP, College, and Honors]
You can use this Statistics Final Exam in an AP Statistics, Honors Statistics, or a College Statistics course as an assessment, review or both. What's Included?Included are 6 different versions, each including 60 well chosen representative questions in both multiple choice format and also in free response format*. These reviews and tests work well in class or as a take- home. The tests are editable with Adobe Acrobat Pro. Each test should take about 2 - 3 hours and can be taken with a graphin
Subjects:
Grades:
10th - 12th, Higher Education
Types:
CCSS:
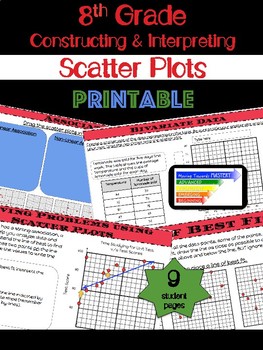
8th Grade Math Constructing & Interpreting Scatter Plots
Extensive printable lessons for constructing and interpreting scatter plots.The lessons are scaffolded to build understanding. Students will progress from identification of terms to making predictions involving bivariate data. The guided lessons will begin with identification, move towards assisted analysis, and conclude with independent practice.Lessons include...♦ Definitions and Visual Representations♦ Identification and Use of Terms → Bivariate Data → Scatter Plot → Linear, Nonli
Subjects:
Grades:
8th - 10th
Types:
CCSS:
Also included in: 8th Grade Math Common Core Growing Bundle
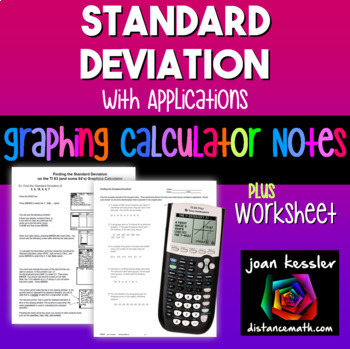
Standard Deviation on TI-84 Reference Sheets plus Practice
With this Determining the Standard Deviation on the TI 83 TI 84 Graphing Calculator plus HW step by step reference sheet your students will learn to use the graphing calculator effectively in finding the standard deviation from a data set. Use as Binder Notes or printed smaller for Interactive Notebooks.What's included?Two reference/handouts for students to learn how to find the Standard Deviation for both a population and for sample. One is for the TI 83 (yes, still in use) and the other for th
Subjects:
Grades:
8th - 11th
CCSS:
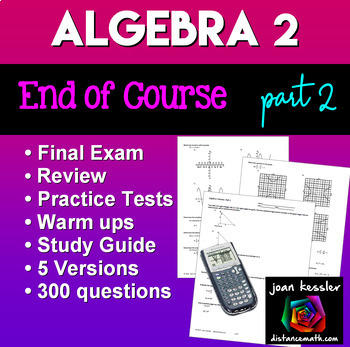
Algebra 2 Final Exam or Review Packet Part 2
This Algebra 2 - Part 2 Review can be used as a Final Exam, or Warm Ups and includes 300 Questions in 5 Versions. It can also be used as a Pretest or review for many topics in PreCalculus. Since Algebra 2 Curriculum differs between schools, I have created this to supplement Algebra 2 End of Course Reviews with 250 Questions Part 1 with topics found in many Algebra 2 curricula, especially those that are Common Core or similar.TOPICS INCLUDE • Conics: Circles, Ellipses, Hyperbolas, Parabolas
Subjects:
Grades:
9th - 12th
Types:
CCSS:
Also included in: Algebra 2 EOC Review or Exam Bundle
Comparing Measures of Central Tendency Worksheet
Hey there, Math MVPs! Are you ready to score big in the world of statistics? Get ready to lace up your skates and find the effects on mean median and mode with this fun worksheet! Why Choose Our Central Tendency Worksheet? Mean, Median, Mode Mastery: Say goodbye to confusion! Our worksheet focuses on calculating mean, median, and mode with a fun twist. Students will dive into the world of statistics by predicting the impact of outliers on data sets and data displays, such as stem and leaf plots,
Subjects:
Grades:
9th
Types:
CCSS:
Also included in: Data and Statistics Worksheets Bundle
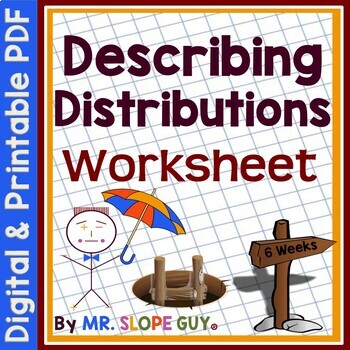
Shapes of Data Distributions Worksheet
Attention math teachers! Are you looking for an easy and effective way to teach your students how to describe distributions in statistics? Look no further! This comprehensive worksheet on "Describing Distributions" is here to help.This worksheet covers all the important concepts of describing distributions, including measures of central tendency, identifying outliers, describing the shape as skewed left, skewed right, or roughly symmetric. With great practice problems, your students will master
Subjects:
Grades:
9th
Types:
CCSS:
Also included in: Algebra Math Riddle Worksheets
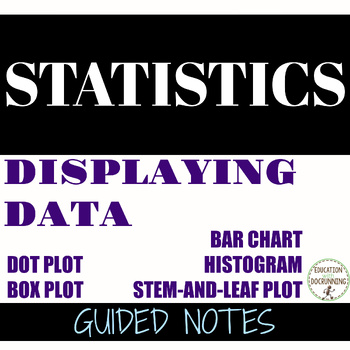
Displaying Data notes Histogram Box Plot Dot Plot Stem and leaf plot
Guided notes for descriptive statistics and displaying data includes bar graph, histograms, dot plots, box plots (aka box and whisker plot), and stem-and-leaf plots. This is Unit 1: lesson 3 in the AP Statistics Curriculum.Included in this resource:Interactive notebook pages graphic organizersGuided notes Practice ("try it") pages for individual or partner work NotesAnswer keyTopics included:Construct and analyze a bar graphConstruct and analyze a histogramBar graph vs histogramConstruct and an
Subjects:
Grades:
9th - 12th
CCSS:
Also included in: Descriptive Statistics AP Statistics
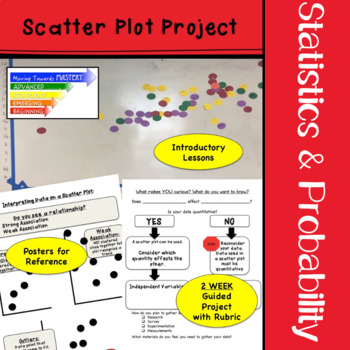
Scatter Plot Project End of Year Math Activity with Real World Data
TWO Week guided project for constructing and interpreting scatter plots. This engaging scatter plot project is individualized to allow students to research areas of interest. This project is great for a math end of year activity but it can also be used year round! Students will gather data on their topic of choice and use the project plan to organize their data into a scatter plot. Students will then analyze the results of the data collected.Six posters to guide students as they work independent
Subjects:
Grades:
8th - 10th, Higher Education
Types:
CCSS:
Also included in: Middle School Math Projects for End of the Year Activities
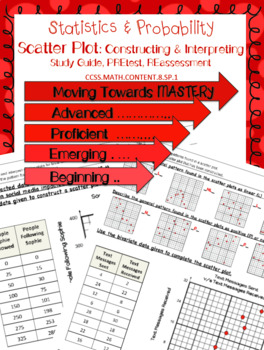
8.SP.1 Construct & Interpret Scatter Plots Pre-test/ Study Guide/ Reassessment
This resource would be useful in the following ways:→ Pre-test before introducing the standard→ Study Guide to prepare for the assessment→ Reassessment This resource will allow you to measure student understanding of how to construct and interpret a scatter plot at various levels of mastery to identify at what level students are prior to instruction or after instruction. Levels of mastery are:→ Beginning → Emerging→ Proficient→ AdvancedEASY printing with answer key-------------------------------
Subjects:
Grades:
8th - 10th
CCSS:
Also included in: 8th Grade Common Core Statistics & Probability Assessments
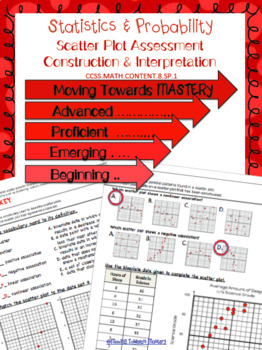
8.SP.1 Scatter Plots: Construction & Interpretation Assessment
Assessment for Scatter Plots: Construction & Interpretation that measures understanding at various levels of mastery to identify at what level students have progressed. Levels of mastery are:→ Beginning → Emerging→ Proficient→ AdvancedEASY printing with answer key--------------------------------------------------------------------------------------------------------------------------------------------------------------These printable worksheets can also be used as digital resources through t
Subjects:
Grades:
8th, Higher Education
Types:
CCSS:
Also included in: 8th Grade Common Core Statistics & Probability Assessments

MEAN MEDIAN MODE RANGE EASEL Activity & Assessment - Skills Snapshot-Diagnostic
Are your students STRUGGLING with MEAN, MEDIAN, MODE & RANGE? Are you trying to identify areas of weakness with these essential math skills? Quickly assess each student’s understanding of these critical concepts!! Address those deficiencies using EASEL -- duplicate & revise the EASEL template to build those skills!We have regrouped exercises from our popular math warm-ups to produce this Snapshot of Students’ Essential Skills in MEAN, MEDIAN, MODE & RANGE using the capabilities of
Subjects:
Grades:
6th - 9th
Types:
Showing 1-11 of 11 results

