Stats&Data Slides Bundle D: Misleading Misinterpreting Surveys Statistics Graphs
- Google Slides™

Description
From the Author of Bossy Brocci
Math & Big Science workbooks on Amazon,
comes student fillable editable interactive
Google Slides™ for Google Classroom™
Students can insert/overlay text & graphics
[textboxes, shapes, lines, arrows, colors etc.]
onto the G-Slide image background
or
Convert to PDF, then make it interactive online
by using various third-party Ed. websites
or
Print it for paper worksheets
=======================
This Bundle on
Misleading & Misinterpreting
Surveys, Statistics, and Graphs/Charts
contains:
- 2 Lessons
- 8 Worksheets
- 78 Problems & Tasks
- and Assessment up the a$$
=======================
Answer KEYS included
=======================
Coverage Specifics:
#1 Misleading & Misinterpreting Surveys & Statistics
+ QUIZ
Students will:
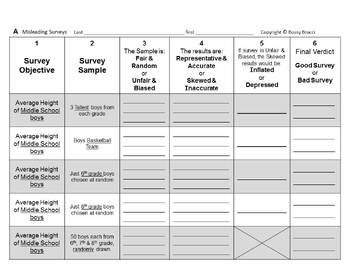
1) Read 10 different Surveys and Survey Samples
2) Determine and Write if those Surveys are:
- Fair & Random
- Unfair & Biased
- Representative & Accurate
- Skewed & Inaccurate
- Inflated
- Depressed
- Good Survey
- Bad Survey
3) Answer 24 Multiple-choice questions
based on their Observations
4) Analyze 5 Statistical Problems & Conclusions for accuracy
with regards to Mean, Median, Mode and Range;
and
Answer 5 Multiple-choice questions based on their analysis
5) Be compelled to show their work in a neat & orderly format
6) Be trained to methodically & systematically analyze
the quality or legitimacy of Surveys & Statistical conclusions
==============
#2 Misleading & Misinterpreting Data
Graphs Charts Statistics
Students will:
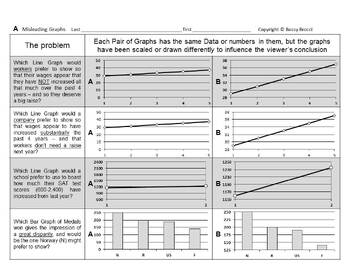
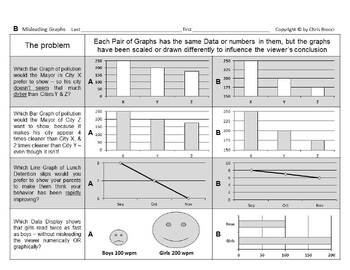
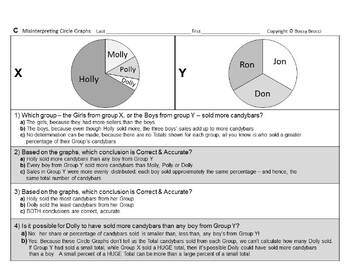
1) Analyze 20 different Graphs or Data Displays
2) Draw Conclusions & Answer questions about the
accuracy, fairness, limitations & legitimacy of those Graphs
3) Answer 16 Multiple-choice questions
based on their Calculations & Observations
4) Be compelled to show their work in a neat & orderly format
5) Be trained to methodically & systematically analyze
the intent & statistical legitimacy of Data Displays/Graphs
=======================
Now THAT’s what I call 'putting the w-o-r-k
back in WORKsheets!’
=====================
Printing: LaNdScApE and
DOUBLE-SIDED sheets of paper,
with the flip being along the 'SHORT' side or edge.
Blank slides included for double-sided printing
=======================
For WORKsheet Lessons & Bundles related to this product:
For all sorts of Brocci Bundles:
And for my FREE product that connects Ocean Pollution to Global Warming:
=======================
Author Creds:
- B.A. History, B.S. Chemistry, M.S. Organic Chemistry
- 124 Credits of University Science
- 27 Credits of University Mathematics
- Phi Beta Kappa, Summa Cum Laude
- Tieszen Award for Calculus, Chemistry, & Physics
- Albertus Magnus Award for Best Instructor at Univ. Maryland, Dept. of Chemistry & Biochemistry
- 4-time North Carolina Top 3 Science Teacher
- 2-Time NC Top Science Teacher [2010 & 2019]
=======================
Questions from the Author:
Have parents [or Principals] up your a$$
about 'challenging' or 'enriching' the kids?
Need something for extra-credit
or a time-killer for fast-finishers?
Ensure that your students leave your class
having written an expository essay/research paper
- - - complete with
proper punctuation,
good grammar,
and correct syntax.
Bossy Brocci's EZ-Writer will automatically
help your students produce anywhere from a:
5 Paragraph/2 Section paper
up to an
11 Paragraph/5 Section paper.
Yes . . . AUTOMATICALLY.
You don't do or teach a thing.
My EZ-Writer does it all:
It teaches students proper
writing, punctuation, grammar
and syntax for you!
It's hot off the presses and submitted
for Copyright registration
in October 2019.
Get the EZ-Writer and tell your Math, ELA
and Social Studies friends about it:
======================
Math Statistics Data Displays Bar Graphs Histogram Histograms Pictograph Pictographs Line Plot Line Plots Stem and Leaf Plot Stem and Leaf Plots Circle Graph Circle Graphs Pie Chart Pie Charts Line Graph Line Graphs Measures of Central Tendency Mean Median Mode Range Measures of Variation Quartile Quartiles Lower Quartile Upper Quartile Interquartile Range Minimum Maximum Outlier Outliers Outlier Tolerance Box and Whisker Plot Box and Whisker Plots Converting Box and Whisker Plots into Measures of Variation Box and Whisker Fractions Percents Distribution Creating Interpreting Bivariate Data Two-way 2-way Tables Misleading Graphs Misleading Data Displays Misleading Statistics Surveys Misleading Misinterpreting Graphs Surveys Statistics


