31 results
Common Core HSS-ID.C.9 resources for Microsoft Word
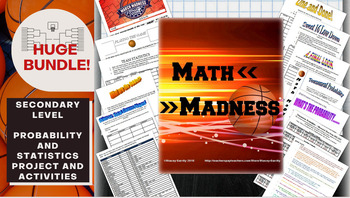
Math March Madness Full Tournament Project {BUNDLE}
Harness the excitement of NCAA March Madness with this huge project for secondary math teachers that follows all stages of the tournament! This Common Core aligned bundle comes with bonus parts not sold individually in my store so you can create a rich immersion in the tournament, practice probability and statistics and learn some interesting new ones along the way! Save $3 plus get bonus content by bundling!You can pick and choose which parts you would like to incorporate, or follow my schedu
Subjects:
Grades:
6th - 12th, Higher Education
Types:
High School Math Common Core Aligned IEP Goal Bank
This IEP goal bank was created to assist special education teachers with the task of writing standards-based IEP goals in math. After spending countless hours developing IEP goals myself and really having to think through how to best individualize goals and objectives for my own students, I wanted to share this resource to help other special education teachers gain back some of their time.This goal bank includes the following:An introduction and guide that explains how to use the document.Each s
Subjects:
Grades:
9th - 12th
CCSS:
High School Math IEP Goal Bank - Statistics and Probability
This IEP goal bank was created to assist special education teachers with the task of writing standards-based IEP goals in math. After spending countless hours developing IEP goals myself and really having to think through how to best individualize goals and objectives for my own students, I wanted to share this resource to help other special education teachers gain back some of their time.This goal bank includes the following:An introduction and guide that explains how to use the document.Each s
Subjects:
Grades:
9th - 12th
CCSS:
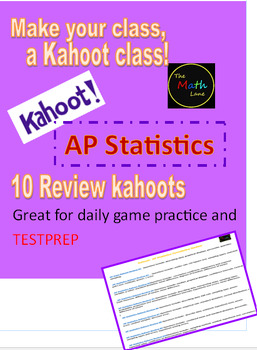
AP Statistics Kahoots (10 total): No Prep game/activity for AP Statistics Exam
Get ready to supercharge your AP Statistics exam prep with these 10 Kahoot links! With 10-15 questions in each Kahoot, your students will have daily practice to help them ace the exam at the end of the year. These Kahoots are specifically designed using AP test material, so you can be sure your students are getting the best preparation possible. Perfect for quick spiral review, warm-ups, or closing out class, these Kahoots are the ultimate tool for helping your students succeed. And with the opt
Subjects:
Grades:
10th - 12th
Types:
CCSS:
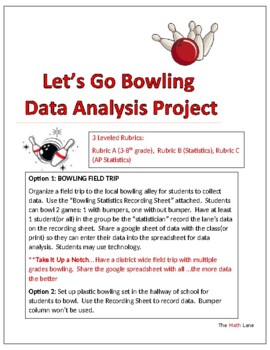
Let's Go Bowling Statistics STEM Project & Field Trip (3-12 and AP Stat)
Great END OF YEAR project. Get ready to strike up some fun with your students on a field trip to the bowling alley or right in your own hallway with a plastic bowling set! This isn't just any ordinary field trip - it's a real-world data collection extravaganza. 3 different leveled rubrics (Grade 4-10, Statistics, AP Statistics) so students can analyze the data based on their math knowledge. Students will be able to practice creating and analyzing graphical displays, scatterplots, construct c
Subjects:
Grades:
Not Grade Specific
Types:
Also included in: High School Statistics Project Bundle
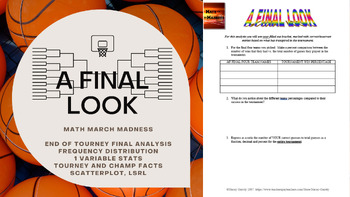
Math March Madness - A Final Look (Freq Distributions, Stats, Regression Lines)
Fill out a bracket, watch the tournament unfold and then mathematically analyze how you did! This activity is flexible enough to be used for a variety of levels. I have used all 6 pages for an AP Statistics class, and have used pages 1 through 5 for an Algebra or Algebra 2 class. You could even use it in lower levels as long as you are covering percents, and basic stats like mean, median, mode and graphing. The document is editable so you can adjust/delete to tailor to the level of statistic
Subjects:
Grades:
4th - 12th, Higher Education
Types:
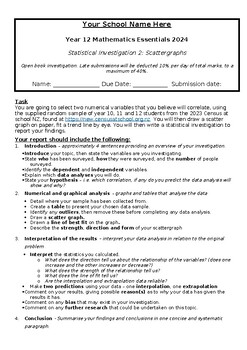
Year 12 Essentials Statistical Investigation - Scattergraphs
Year 12 essentials Statistical Investigation fully aligned to the Western Australian curriculum and SCSA investigation requirements Students to choose 2 numerical variables from the random data sample provided, that they believe will correlate, then analyse the data and complete a statistical report on their findings. Requires students to: create a table of date and scattergraph, fitting a line of best fit, interpolation and extrapolation of data, commenting on causality v correlation. Comes as
Subjects:
Grades:
12th
Types:
CCSS:
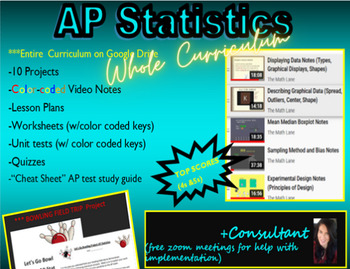
AP Statistics/Stats FULL Curriculum LINK (notes, wksts, PROJECTS) and Consultant
Get ready to supercharge your students' AP Statistics experience with this dynamic curriculum! With over 50% of students earning 4s or 5s on the AP exam, this program is proven to deliver top results. Featuring color-coded video notes, worksheets, activities, and 10 engaging projects, this curriculum is designed to keep students engaged and excited about statistics. Plus, with a Bowling Field Trip Project Opportunity included, students will have the chance to apply their knowledge in a real-worl
Subjects:
Grades:
10th - 12th
CCSS:
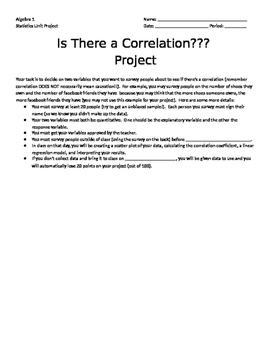
Correlation Project
This is a project I have done at the end of a Statistics unit in Algebra 1. Students survey at least 20 people with two quantitative questions and do a correlation study. The students make a scatter plot and find the line of best fit. Then, they find the linear regression and r value in a calculator and interpret them.
Subjects:
Grades:
9th - 11th
Types:
CCSS:
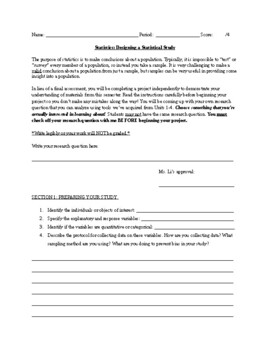
Statistics Project: Regressions + Designing a Statistical Study for High School
Hello!I've designed a statistics project that students in my class loved! This project requires students to go collect data on a topic that interests them. They have to design a sampling method that is as unbiased as possible. Students are then required to analyze their data and summary statistics. They also need to do a regression analysis on their study and make inferences using their results. This is perfect for a replacement of a test or as an end-of-semester project for students. Perfect fo
Subjects:
Grades:
9th - 12th, Higher Education
Types:
CCSS:
Also included in: AP Statistics / High School Statistics Projects
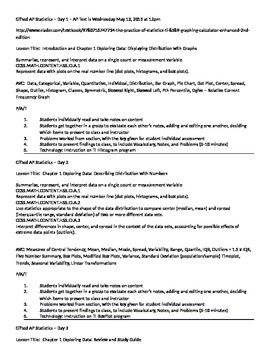
AP Statistics Lesson Plans for 29 Days with CCSS Included
Lesson Plans for High School teachers of AP Statistics. Includes the first half of the course. Common Core State Standards are included for every lesson. Easy to copy and paste into school district lesson plan site. Includes technology, group work, peer evaluation, independent study, and a common sense approach to the day by day student lead teaching of the AP Statistics course. Great template for COMPASS.
Subjects:
Grades:
12th, Higher Education
Types:
CCSS:
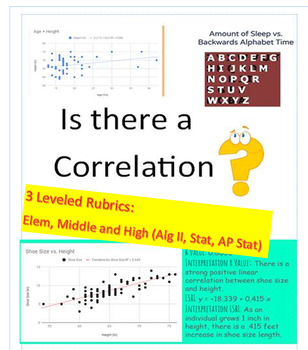
Correlation? Data Project (3 Rubrics_Elem/Middle School/ AP Stats) EOY
Get ready to supercharge your students' data analysis skills with this dynamic project! Perfect for end of year or semester project. In this engaging activity, students will have the exciting opportunity to collect their own data through surveys, online research, or real world data sets. They will then dive deep into the world of statistics as they determine if there is a correlation between two variables. With three different leveled rubrics, this project is perfect for students of all ages an
Subjects:
Grades:
Not Grade Specific
Types:
CCSS:
Also included in: High School Math Projects (Algebra II and Statistics) STEM No prep
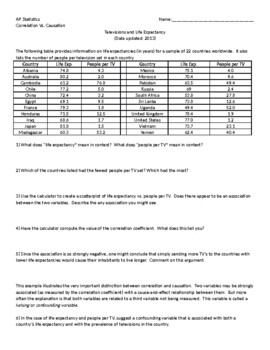
AP Statistics: Correlation vs. Causation Worksheet
This activity has students graph and analyze a 2-variable data set. Students are asked to comment on the correlation and draw conclusions about causation based on the results. Real-life data involving life expectancy and people per TV provided.
Subjects:
Grades:
10th - 12th
Types:
CCSS:

Algebra 1 - Linear Equations - Complete Unit
Our students often struggle with understanding the concepts behind linear relationships and never quite make the connection between the different ways to represent a relationship (equations, charts or graphs). This unit is designed to help students ask and answer deeper questions about what makes a linear relationship and what properties all linear relationships share. It also gives students the practice they need to build fluency.
Lessons are based around and begin with real-world, context
Subjects:
Grades:
8th - 10th
Types:
CCSS:
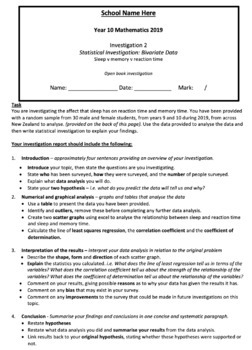
Year 10 Mathematics Statistical Investigation - Sleep v Memory v Reaction Time
Year 10 Investigation – Sleep v Memory v Reaction TimeThe statistical investigation is on the supplied bivariate data, using scatter graphs to analyse the relationship between sleep and memory and sleep and reaction time.Students will calculate and interpret the least squares line of regression, Pearson's correlation coefficient and the coefficient of determination. Students will complete a full statistical report, including introduction, data analysis, data interpretation and conclusion. Fully
Subjects:
Grades:
10th
Types:
CCSS:
Also included in: Year 10 Mathematics Assessments
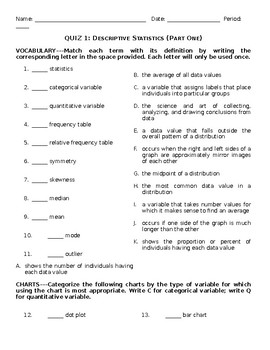
Mid-Chapter Quizzes: Descriptive Statistics
Includes two quizzes and answer keys covering topics in a unit on descriptive statistics. Topics include: mean, median, mode, bar charts, dot plots, histograms, outliers, correlations, quantitative variables, categorical variables, symmetry, skewness. These quizzes are mostly vocabulary, with a few short answer questions.
Subjects:
Grades:
9th - 12th
Types:
CCSS:
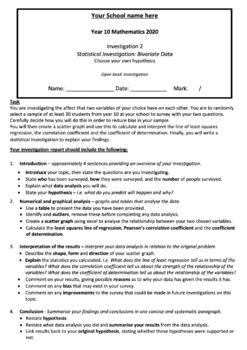
Year 10 Mathematics Statistical Investigation - Choose Your Own Hypothesis
Year 10 Investigation – Statistical Investigation This statistical investigation is on bivariate data, using scatter graphs to analyse the relationship between the variables.Students are to create their own hypothesis, create a survey and analyse the data they collect. Included on the task sheet is a list of possible hypotheses.Students are to use technology (excel or Classpad) to calculate and interpret the least squares line of regression Pearson's correlation coefficient and the coefficient o
Subjects:
Grades:
10th
Types:
CCSS:
Also included in: Year 10 Mathematics Assessments
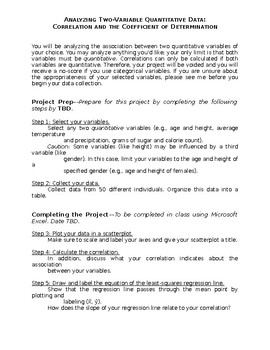
Project: Correlations (Analyzing Bivariate Quantitative Data)
Project guidelines and rubric for a project on correlations. Students collect their own data, create a scatter plot, and calculate and analyze the correlation coefficient and coefficient of determination.
Subjects:
Grades:
9th - 12th
Types:
CCSS:
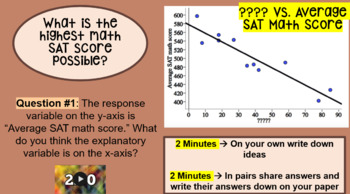
Stats: Inequities in Student Achievement & Poverty (PPT, NOTE SHEET-KEY, CFU)
Empower students to be able to interpret relevant data and make informed decisions based upon that data.Activity Based Learning where students experience first and then formalize their thoughts later.Extremely relevantMath discourse- a lot of room for conversation and critical thinkingProblem solving, reasoning, representation, communication, and connections … Oh my!When and Whereo Pre-Algebra/Algebra 1/Algebra 2: Linear Functions and Equationso Data and Statistics: Analyzing Two-Variable Datao
Subjects:
Grades:
9th - 12th
CCSS:
Population Graph Analysis
Students examine graphs showing population fluctuations of two related species in the San Francisco Bay area and answer questions based off of their observations. The activity reviews a plethora of terms and concepts pertaining to Ecology and Biology, such as reproductive strategies, carrying capacity, symbiotic relationships, etc.
Subjects:
Grades:
7th - 12th
Types:
CCSS:
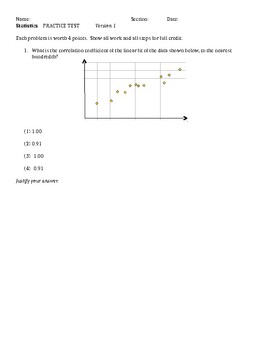
Algebra 1 Tests- Statistics Unit - 3 versions
Included are 3 versions of an Algebra 1 Unit Test on Statistics. The main topics being assessed are interpreting the correlation coefficient, comparing and computing measures of central tendency, finding the least squares regression line and making predictions, constructing a box and whisker plot, using quadratic regression and constructing and interpreting a residual graph. Each version is very similar to the others; the problems have different numbers but the type and level of problem is the
Subjects:
Grades:
8th - 10th, Staff
Types:
CCSS:
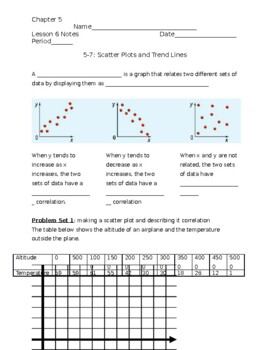
Scatter Plots & Trend Lines Notes
Chapter 5, Section 7 of Pearson Algebra 1 textbook
Grades:
8th - 9th
Types:
CCSS:
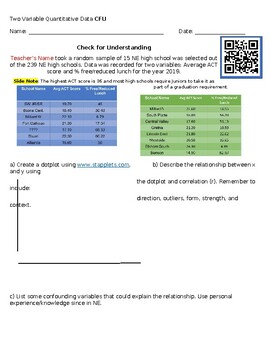
Stats: Inequities Between Student Achievement and Poverty CFU
Empower students to be able to interpret relevant data and make informed decisions based upon that data.Activity Based Learning where students experience first and then formalize their thoughts later.Extremely relevantMath discourse- a lot of room for conversation and critical thinkingProblem solving, reasoning, representation, communication, and connections … Oh my!When and Whereo Pre-Algebra/Algebra 1/Algebra 2: Linear Functions and Equationso Data and Statistics: Analyzing Two-Variable Datao
Subjects:
Grades:
9th - 12th
Types:
CCSS:
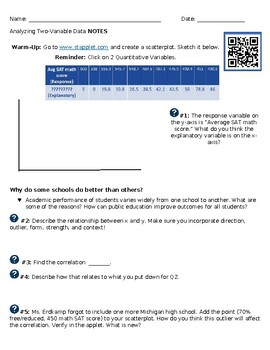
Stats: Inequities Between Student Achievement and Poverty Guided Notes
Empower students to be able to interpret relevant data and make informed decisions based upon that data.Activity Based Learning where students experience first and then formalize their thoughts later.Extremely relevantMath discourse- a lot of room for conversation and critical thinkingProblem solving, reasoning, representation, communication, and connections … Oh my!When and Whereo Pre-Algebra/Algebra 1/Algebra 2: Linear Functions and Equationso Data and Statistics: Analyzing Two-Variable Datao
Subjects:
Grades:
9th - 12th
Types:
CCSS:
Showing 1-24 of 31 results

